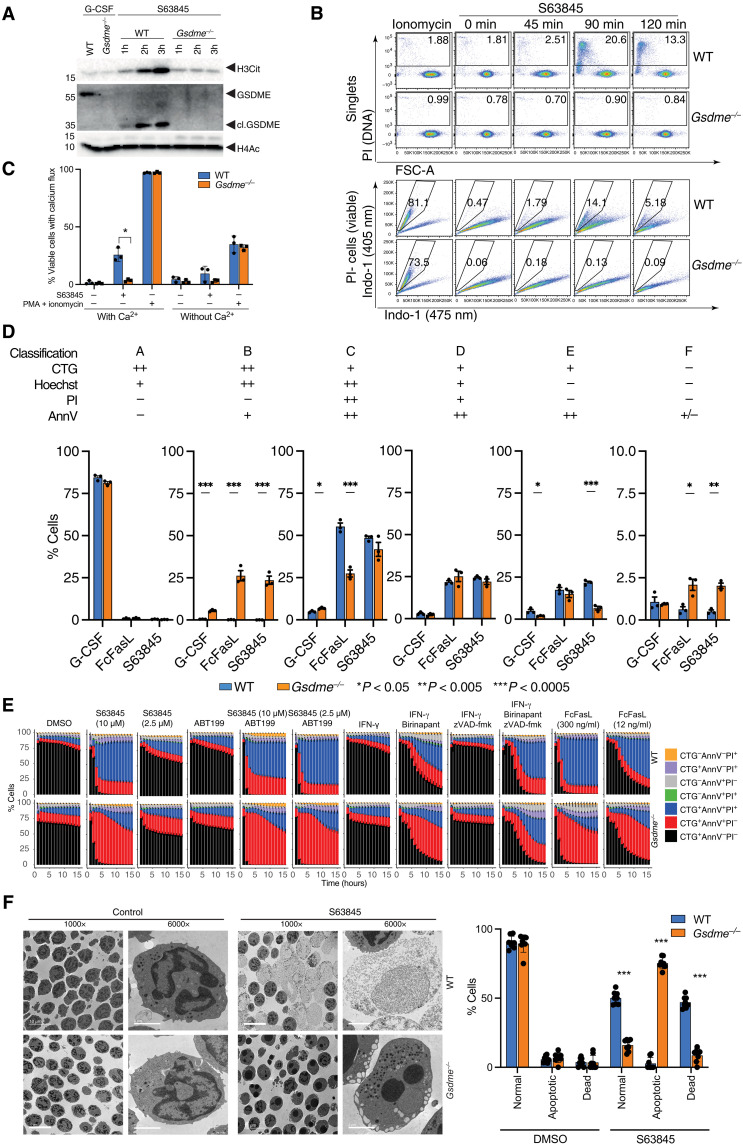
Fig. 4. Mcl-1 antagonism triggers GSDME cleavage leading to Ca2+ influx, PAD4 activation, and H3Cit accumulation.
(A) Protein expression levels of H3Cit, (cl.) GSDME, (cl.) caspase 3, and H4Ac in freshly isolated WT and Gsdme−/− BM neutrophils or treated with S63845 and G-CSF. (B) Top: Flow cytometry evaluation of PI+ cells in single WT and Gsdme−/− neutrophils treated with S63845 for 0, 45, 90, and 120 min. Frequency of PI+ cells are indicated on each plot. Bottom: Ca2+ influx is determined in PI-(viable) neutrophils by switch of Indo-1 (475 nm)–positive to Indo-1 (405 nm)–positive staining. Frequency of Indo-1 (405 nm) calcium fluxing cells is indicated on each plot. (C) Calcium flux in neutrophils treated with S63845 for 90 min or PMA + ionomycin for 30 s in the presence or absence of 1.8 mM extracellular calcium in Dulbecco’s modified Eagle’s medium (DMEM). (D) Statistical analysis of automated cell clusters identified by flow cytometry measurement of cell size and granularity, PI, AnnV, CTG, and Hoechst in WT and Gsdme−/− neutrophils treated as indicated. Means ± SEM, n = 3 independent biological replicates, significance is determined by unpaired t tests, *P < 0.05, **P < 0.005, ***P < 0.0005. (E) Kinetic changes in WT and Gsdme−/− neutrophil viability by live-cell imaging and automated image analysis in the presence of the indicated stimuli. (F) Morphology of WT and Gsdme−/− neutrophils after treatment with S63845 for 2.5 hours. ×1000 or ×6000 magnification by electron microscopy.

