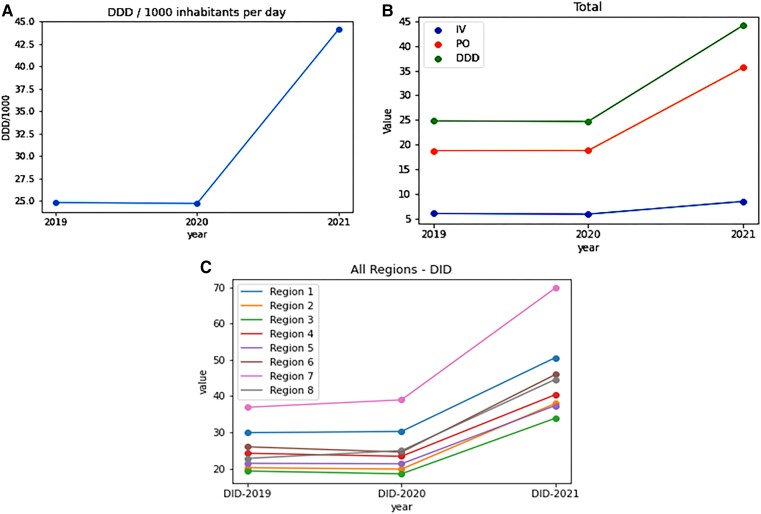
Figure 1.
A, DID values presented by year. Increase in consumption was observed between 2020 and 2021. B, National DID values for cumulative per-oral and intravenous consumption. Highest use was observed through per-oral route. C, DID values by Region. Region 7 had the highest DID value (70) followed by Region 1 (50) and Region 6 (45). Abbreviations: DDD, defined daily dose; DID, daily dose per 1000 inhabitants per day.

