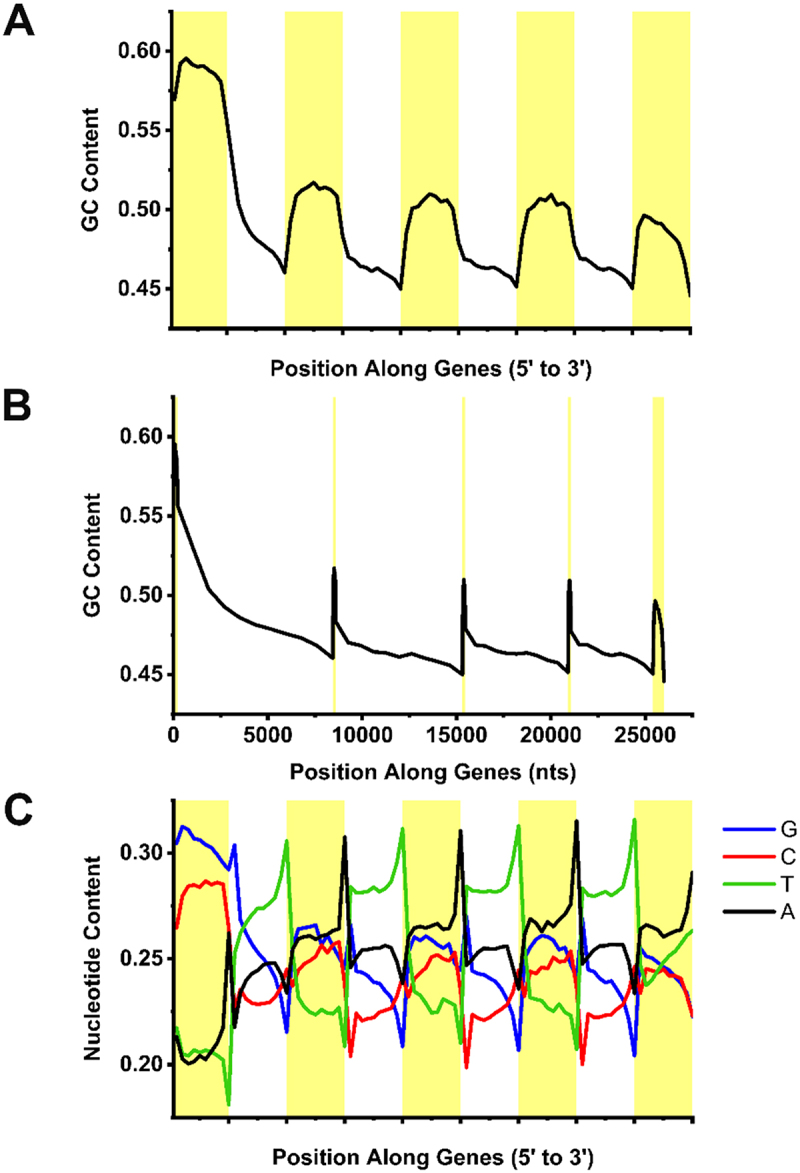
Figure 2.

Sequence features of mRNAs. A-B) GC-content averaged over each exon (yellow) and intron (white) of all human protein-coding genes with 5 exons plotted from 5’ to 3’ ends. Note that in (A) each exon and intron metaplot was normalized, while in (B) they were adjusted to reflect the average length of each exon and intron of all genes in the dataset. C) Similar to (A) except that the average nucleotide-content of the coding strand was plotted from 5’ to 3’ ends.
