Figure 2.

HLA-Q209L and HLA-Q209P binding prediction.
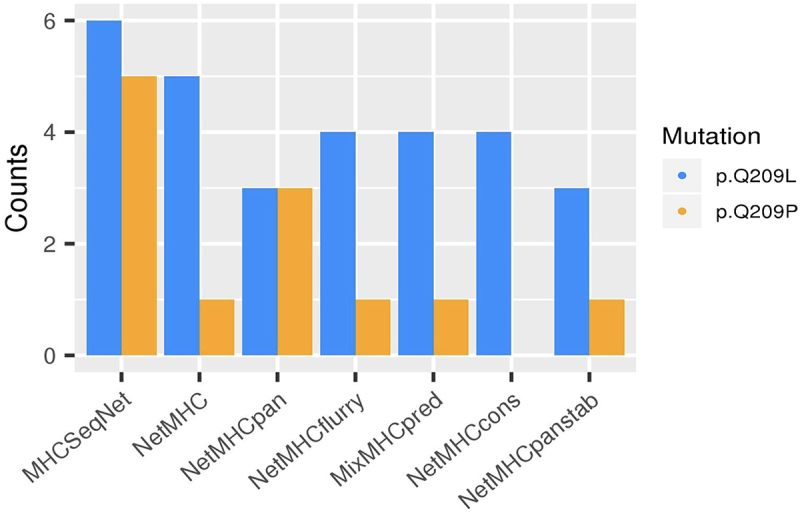
Bar plot showing the number of successful bindings predicted of Q209L change (in blue) and Q209P (in orange) across seven prediction tools (in x axes), using HLA supertype genotypes.

HLA-Q209L and HLA-Q209P binding prediction.
Bar plot showing the number of successful bindings predicted of Q209L change (in blue) and Q209P (in orange) across seven prediction tools (in x axes), using HLA supertype genotypes.