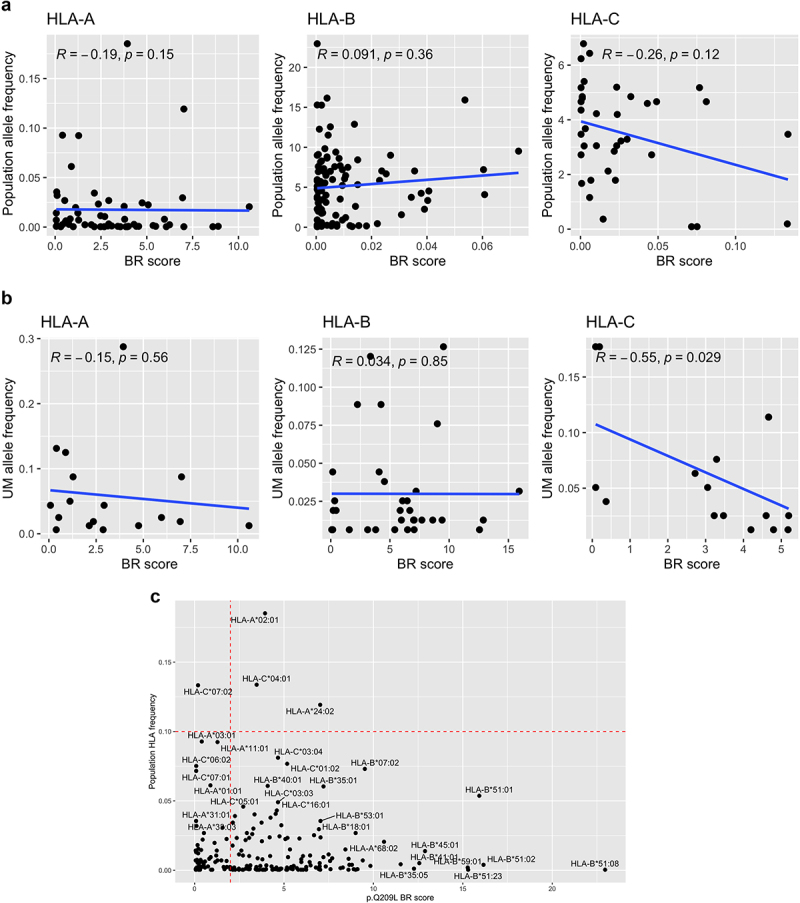
Figure 5.

Correlation between presentation probability and HLA haplotypes.
Plots show correlation between BR score of Q209L and the HLA-A, HLA-B and HLA-C type frequency in (a) general population and (b) in UM patients. c) Plot showing BR score for Q209L in the x-axis and population HLA frequency in the y-axis with HLA haplotypes of high frequency annotated.
