
Figure 6.
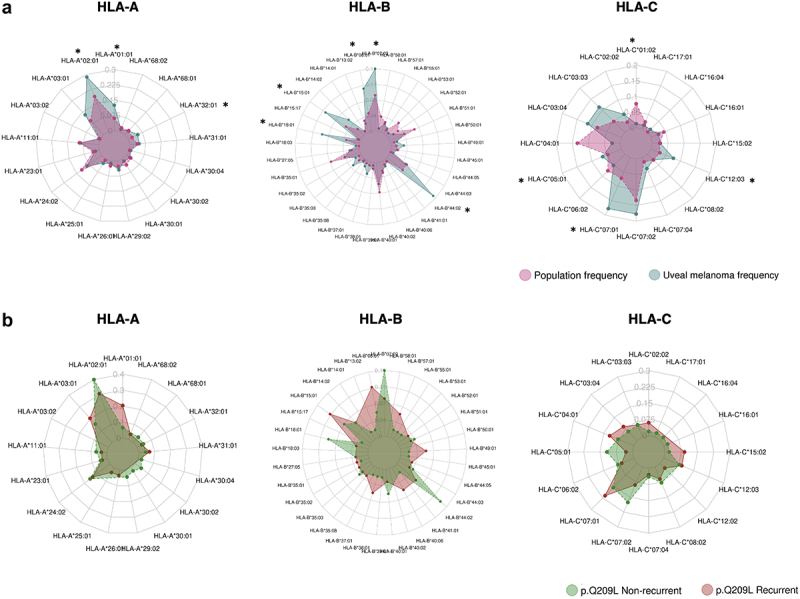
HLA frequency association with UM risk and survival.
Radar plots comparing frequencies in HLA haplotype for HLA-A, HLA-B, and HLA-C genes between UM patients (green) and 1000 G individuals (purple) (a), and between recurrent (red) and non-recurrent (green) patients harboring Q209L (b). Asterisks correspond to haplotypes with statistical differences by Binomial test (FDR p-adjusted <.05). Only haplotypes which are present in uveal melanoma patients are depicted.