
Figure 1.
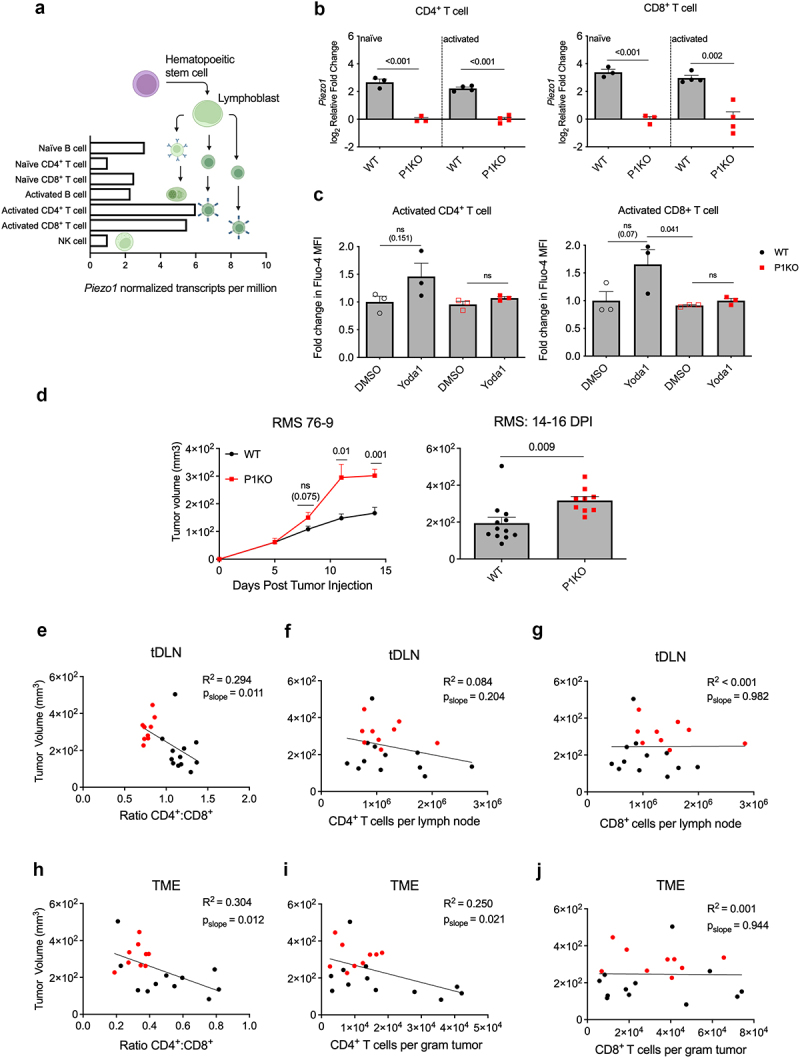
Phenotype of tumor-bearing P1KO mice. (a) RNA sequencing data from the human protein atlas demonstrating normalized PIEZO1 expression among lymphocyte subsets. (b) Transcripts of Piezo1 in CD4+ (left) and CD8+ (right) T cells after 3-day stimulation with anti-CD3/CD28 antibodies were assessed using RT-qPCR. (c) Polyclonal CD4+ (left) and CD8+ (right) T cells were subject to anti-CD3/CD28 stimulation for 48 hours before being loaded with Fluo4-AM. Cells were briefly exposed to 25 μM Yoda1 and Fluo4 fluorescence was assessed by flow cytometry. (d) Tumor growth curve of RMS 76–9 bearing mice (left) with tumor volume on days 14–16 post tumor injection (DPI) (right). Day 14–16 tumor volumes as a function of the CD4+:CD8+ T cell ratio (e,h), CD4+ T cell count (f,i) or CD8+ T cell count (g,j) in tumor draining lymph node (tDLN) and tumor microenvironment (TME), respectively. R2 and p-value of slope calculated using simple linear regression analysis. Data shown pooled from at least 2–3 independent experiments. Plots of group means, standard error, and associated p-values between groups. ns = not statistically significant at an alpha of 0.05.