
Figure 2.
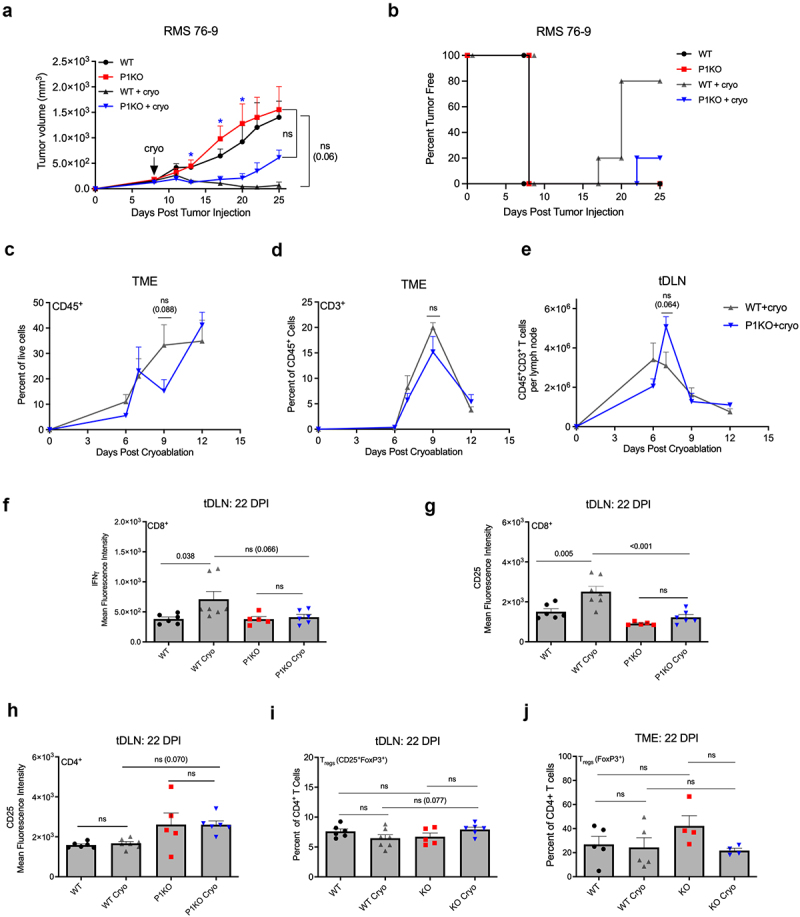
Piezo1 deficient mice fail to respond to immunogenic tumor challenge. (a) 1 × 10⁶ RMS were inoculated s.c. In WT or P1KO mice. Tumors were cryoablated on day 8 (arrow) and their volumes were measured following cryoablation. Blue star (*) indicates a p-value <0.05 obtained from one-way ANOVA testing between P1KO and P1KO+cryo groups, with an alpha of 0.05. (b) Kaplan–Meier curve for tumor-free survival among different groups of mice (n = 4–5 mice per group). (c) Frequencies of CD45+ and CD3+CD45+ cells gated on live singlets from tumor samples at various timepoints following cryoablation. (d) Total CD3+ T cell counts from the tumor microenvironment (TME) and (e) tumor draining lymph node (tDLN) following cryoablation. Two weeks following cryoablation CD3+CD8+ T cells from the tDLN were examined for expression of IFNγ (f) and CD25 (g) as determined by mean fluorescence intensity (MFI). CD3+CD4+ T cells were also examined for CD25 expression (h). Frequency of FoxP3 on CD4+ T cells taken from the tDLN (i) or TME (j) 2 weeks following cryoablation. Plots of group means, standard error, and associated p-values between groups. ns = not statistically significant at an alpha of 0.05. DPI = days post tumor injection.