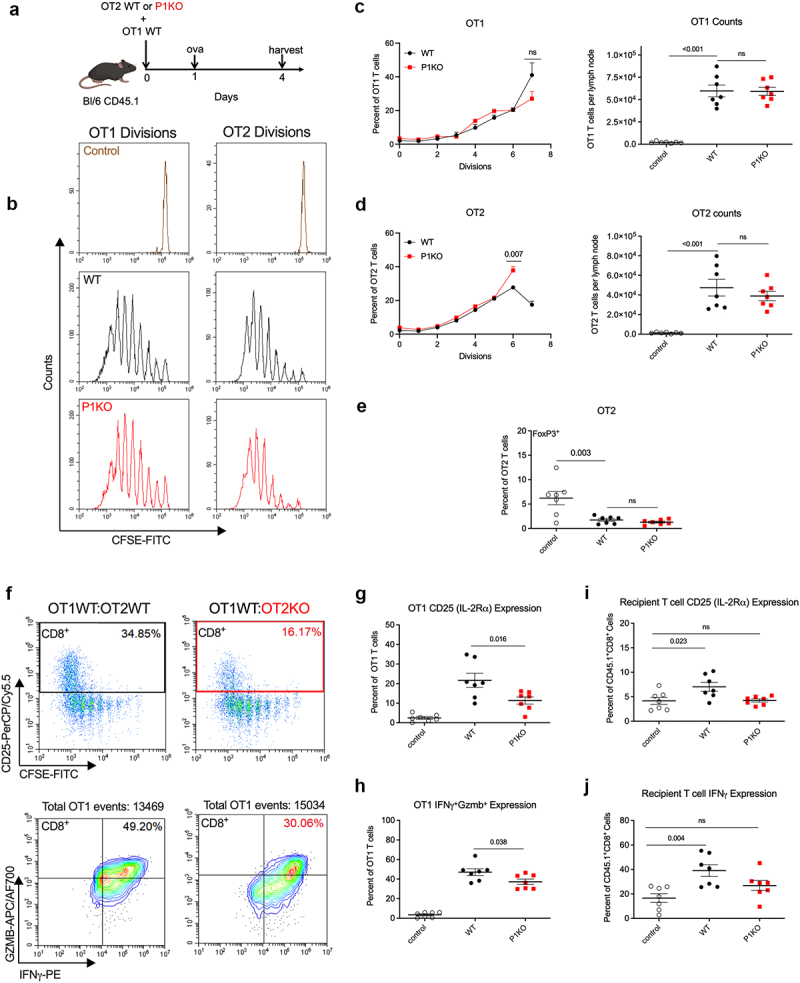
Figure 5.

Piezo1 on CD4+ T cells directs optimal CD8+ T cell activation. (a) Schematic of in vivo Treg suppression assay. A 1:1 ratio of OT1WT and OT2WT or OT2KO T cells were transferred into CD45.1 donor mice, with subsequent ovalbumin immunization. (b) CFSE dye dilution peaks of adoptively transferred OT1 (left) T cells into donor mice receiving OT2 WT but sham immunization with saline (control, brown), OT2WT (black) or OT2KO (red) with ovalbumin immunization. (c) Quantification of divisions of OT1 T cells (left) and total counts (right) of transferred OT1 T cells in the ovalbumin immunization site draining lymph node. (d) Quantification of divisions (left) and total counts (right) of OT2 T cells. (e) Expression of FoxP3 on draining lymph node OT2 T cells. (f) Flow analysis of OT1WT T cells co-transferred with either OT2WT (left, black) or OT2KO (right, red) T cells. Gating for CD25+ (top) and IFNγ+Gzmb+ (bottom) OT1s. (g) Quantification of CD25 positive and IFNγ+Gzmb+ double positive (h) OT1 populations. (h) Percent positive expression of CD25 (i) IFNγ (j) among recipient CD45.1+CD8+ cells in the immunization site draining lymph nodes. Plots of group means, standard error, and associated p-values between groups.
