
Figure 6.
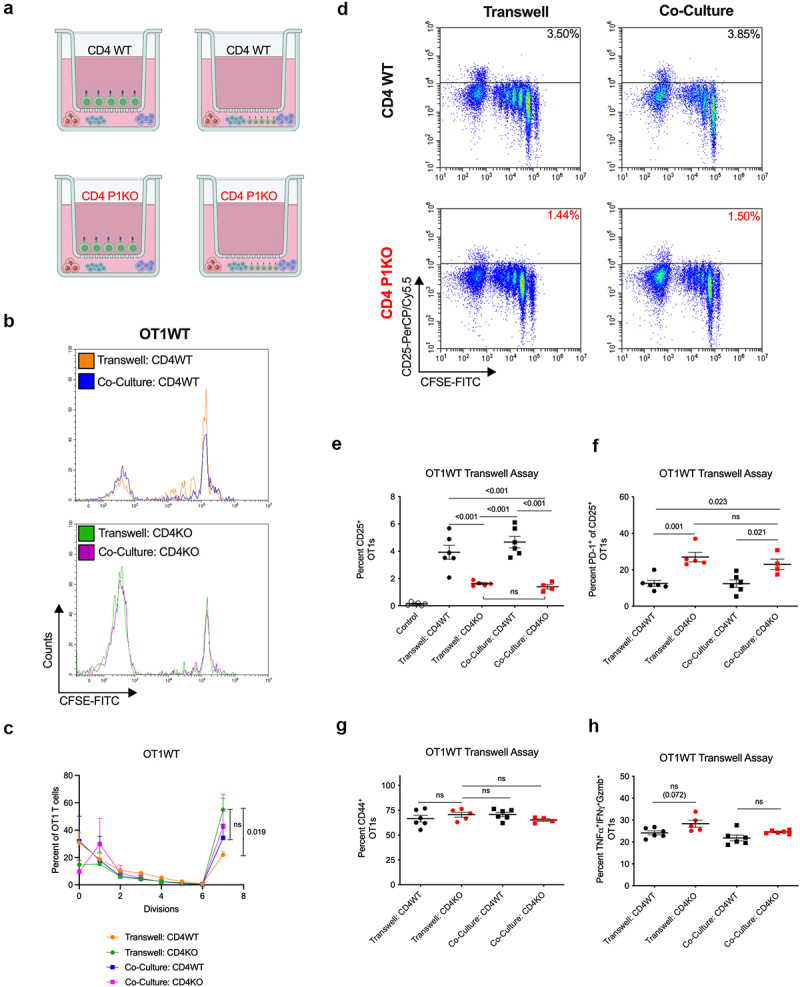
Antigen specific activation of CD8+ T cells in the presence of contact or contactless CD4 help. (a) Experimental strategy. Activated, polyclonal WT (top) or P1KO (bottom) CD4+ T cells were placed in transwell inserts above (left) or directly co-cultured with (right) naïve CD8+ OT1 T cells, RMS-OVA tumors, and irradiated splenocytes. (b) CFSE dilution curves for OT1 T cells cultured with WT (top) or P1KO (bottom) CD4+ T cells. (c) Quantification of cell divisions of OT1 T cells. (d) Flow analysis of OT1 T cells under various culturing conditions. Gating for CD25+ OT1s. (E) Percent CD25+ OT1 T cells. (f) Percent PD-1+ of CD25+ OT1s. (g) Percent TNFα+/IFNγ+/Gzmb+ OT1s undergoing at least 7 rounds of divisions. Plot of group means, standard error, and associated p-values between groups. ns = not statistically significant at an alpha of 0.05.