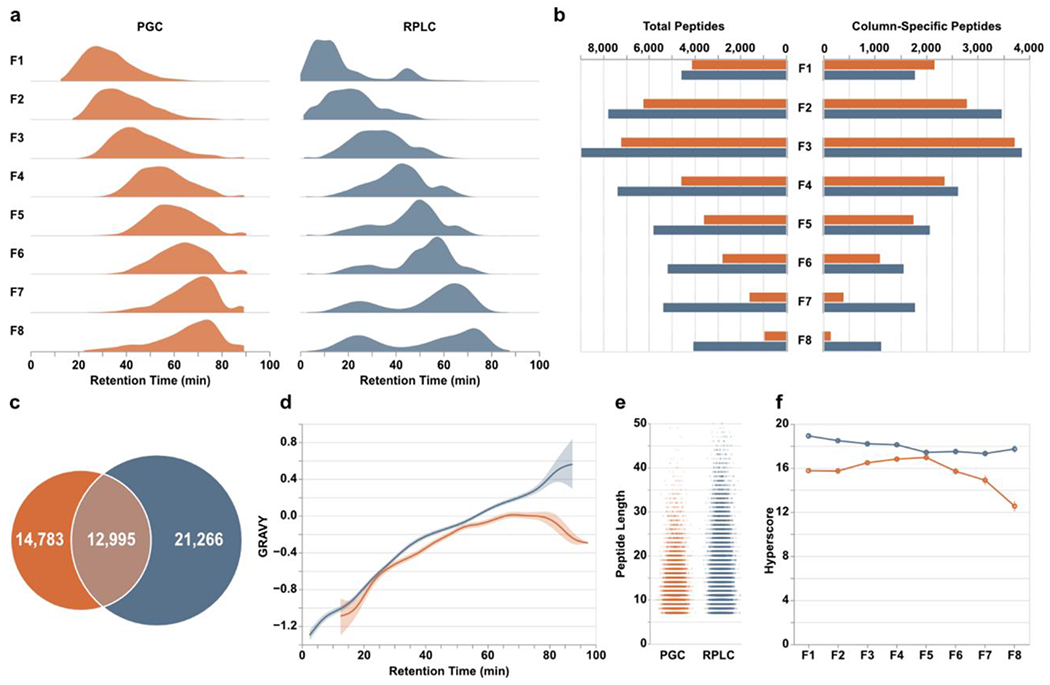
Figure 2.

Peptide-level differences between PGC (orange) and RPLC (blue) analyses. a) Density plots displaying the time points during which peptides were identified. b) Total peptides (left) and number of column-specific peptides (right) identified in each fraction. “Column-specific” refers to peptides identified only through that single separation modality. c) Overlap of all peptides identified in all fractions. d) Relative hydrophilicity of all peptides identified within a given separation method. Grand average of hydropathy (GRAVY) calculations are grouped by retention time and averaged across fractions. e) Jitter plots displaying the length of peptides identified through both separations. f) Line plots displaying the average hyperscore, an MSFragger metric of confidence, for all peptides in a single fraction, partitioned according to the separation that retained them.
