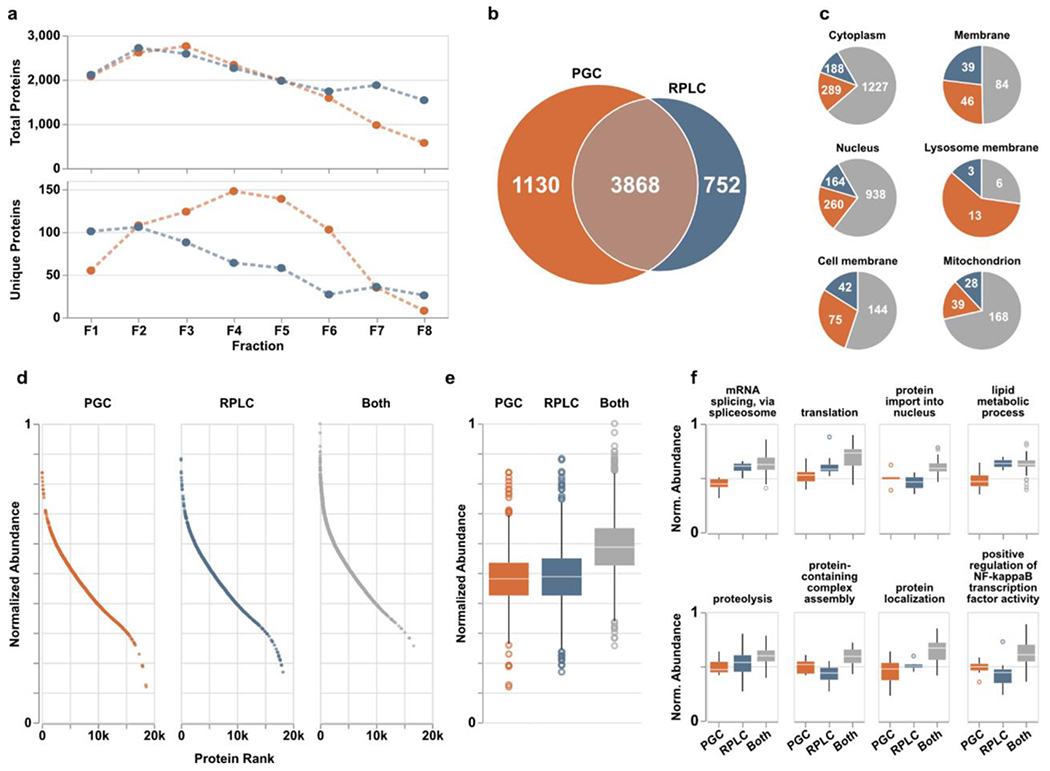
Figure 3.

PGC analyses (orange) provide enhanced protein identification compared to RPLC (blue) alone. a) Quantities of total (top) and column-specific (bottom) proteins identified in each fraction. “Column-specific” refers to peptides identified only through that single separation modality. b) Overlap of proteins identified across all fractions. c) Six representative cellular compartments displaying the number of proteins localized within those compartments and through what separations they were identified; PGC (orange), RPLC (blue), both columns (gray). d) Proteins identified across all fractions sorted and ranked according to expected protein abundance within the human proteome of ~20,000 proteins. Expected abundances are normalized according to quantities estimated in the protein abundance database, Pax-DB (see Supporting Information). e) Boxplots displaying the distribution of protein abundances identified in either separation. Statistical differences noted in text or in available. f) Representative biological processes identified across all fractions with boxplots displaying the distribution of protein abundances identified within those pathways. Statistical significance may be generated from supplementary Table S3.
