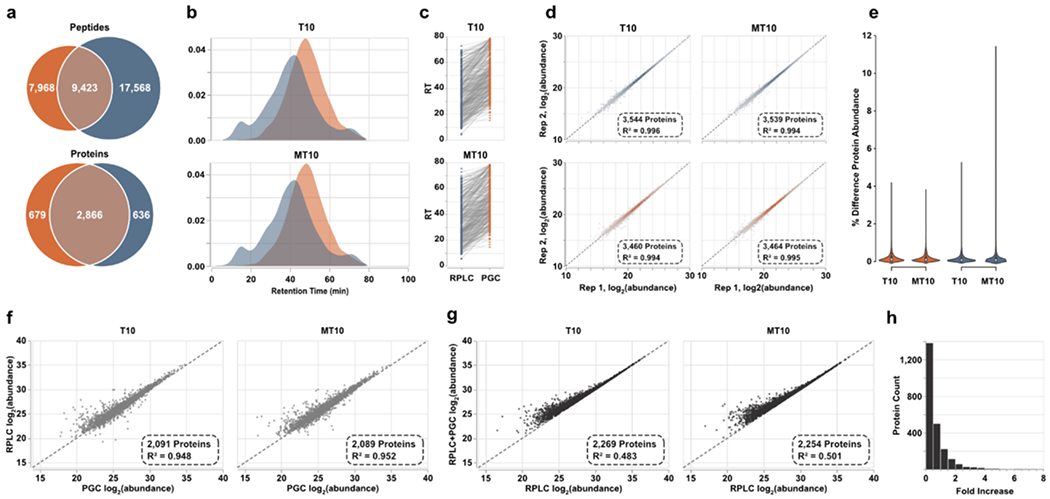
Figure 4.

Spectral library-based DIA-MS analysis of prostate cell lines. a) Overlap of peptides and proteins identified through both separations. Results are combined across the two cell lines analyzed. b) Density plots representing the elution profiles of peptides identified in both PGC and RPLC experiments. c) Retention times of representative peptides identified through both separation paradigms displaying the significantly later times associated with PGC analysis. d) Intrasample reproducibility of protein-level abundance calculated after DIA-MS analyses. e) Violin plots displaying the percent difference in protein abundance between technical replicates. f) Scatter plot displaying the agreement of protein abundances when using peptide precursors identified in both separation regimes. g) Protein abundances calculated using all proteotypic peptide precursors plotted against protein abundances estimated using only precursors found in RPLC analyses. h) The count of proteins showing increased abundance estimations after PGC peptides are included. Vertical bars represent count and horizontal axis is the binned fold increase as calculated by .
