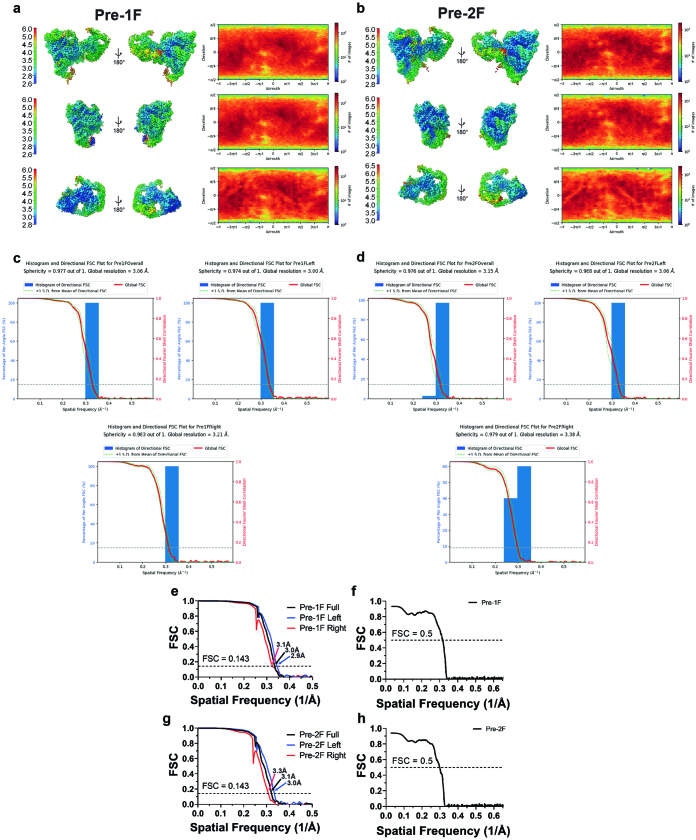
Extended Data Fig. 3. CryoEM Validation for the Pre-1F and Pre-2F RNPs.
a. Local resolution and particle distribution of the pre-1F overall and the locally refined pre-1F (left) and pre-1F (right) maps. b. Local resolution and particle distribution of the pre-2F overall and the locally refined pre-2F (left) and pre-2F (right) maps. c. 3DFSC analysis of the pre-1F overall, the focused refined pre-1F (left) and the focused refined pre-1F (right) reconstructions. d. 3DFSC analysis of the pre-2F overall, the focused refined pre-2F (left) and the focused refined pre-2F (right) reconstructions. e. FSC curves with the gold standard threshold of 0.143 for the three pre-1F RNP maps. f. Map to model FSC curve for the pre-1F model refined against the pre-1F overall map. g. FSC curves with the gold standard threshold of 0.143 for the three pre-2F RNP maps. h. Map to model FSC curve for the pre-2F model refined against the pre-2F overall map.

