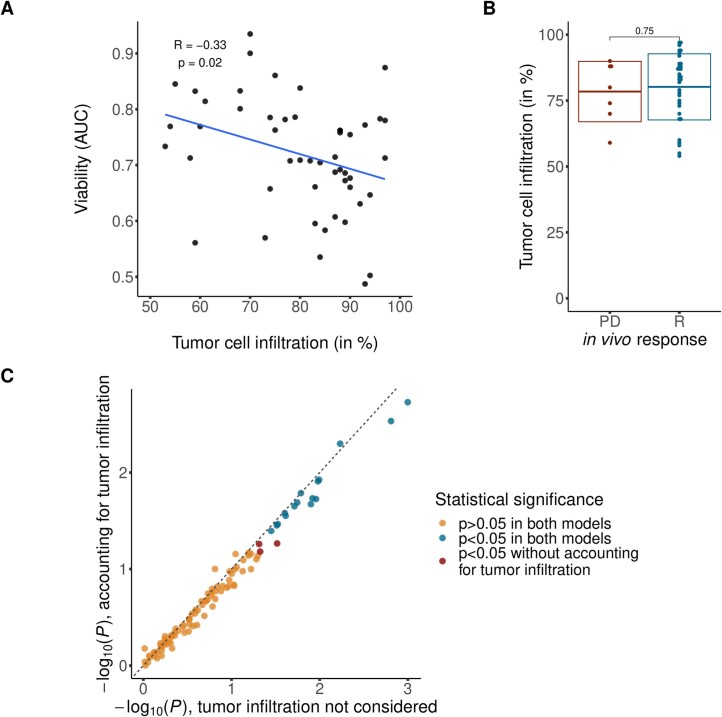
Extended Data Fig. 6. Tumor cell infiltration.
(a) Association between tumor cell infiltration and ex vivo drug response to chemotherapeutic agents in patients treated with chemotherapy. Ex vivo drug response per patient was averaged within the group of chemotherapeutic agents. Pearson correlation coefficient and respective P value from two-sided Pearson correlation shown in the plot. (b) Tumor cell infiltration stratified by in vivo response groups. Each dot represents one patient sample, the boxes show mean +/− standard deviation. P value from two-sided Student’s t-test. (Clinical response (R): n = 34, Progressive disease (PD): n = 7). (c) Significance in individual drug effect size between the clinical response groups as shown in Fig. 3b. P values from two-sided Student’s t-test with (y-axis) and without (x-axis) taking tumor infiltration into account.

