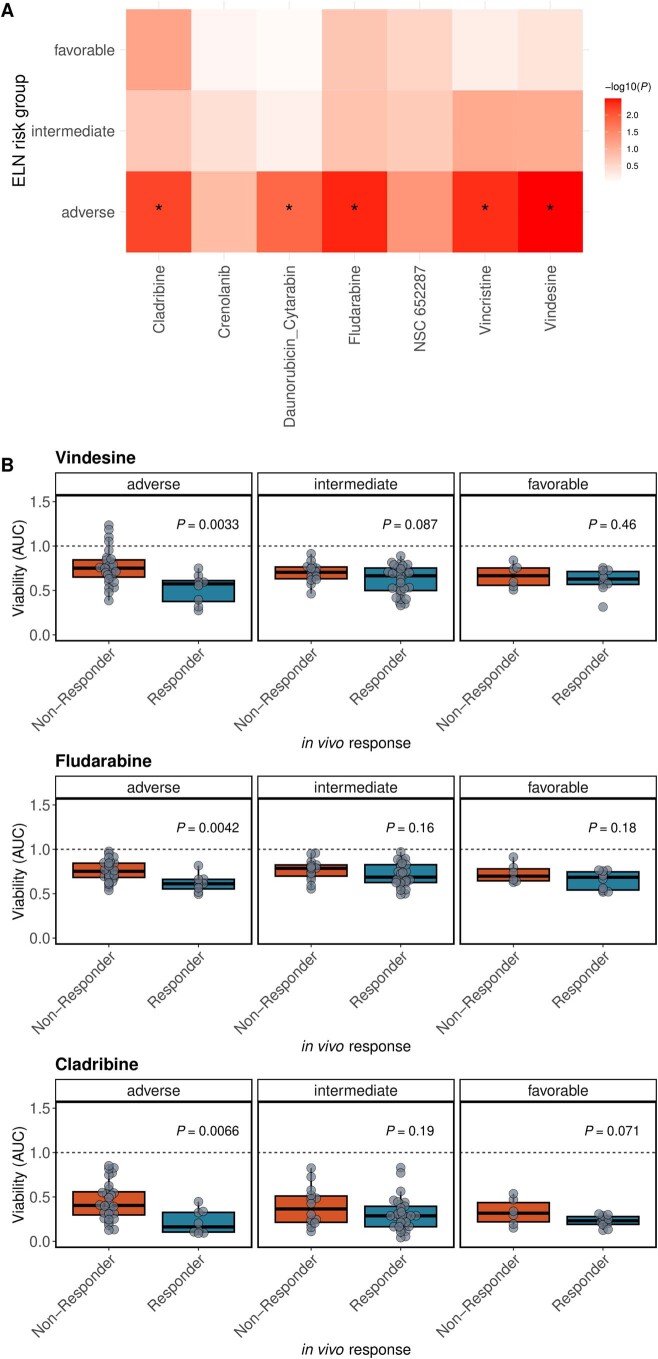
Extended Data Fig. 9. Significantly different ex vivo drug responses between responders and non-responders in ELN-22 risk groups.
(a) Heatmap of p-values from two-sided Student’s t-tests between ex vivo drug response and in vivo therapy response. BH-adjusted p-values below 0.1 are marked with an asterisk. (b) Boxplots showing viability (AUC) after ex vivo drug treatment for drugs with significantly different responses in responders and non-responders in ELN-22 risk subgroups. Corresponding to Fig. 4c. P-values from two-sided Students t-tests. Responder: n = 47, Non-responder: n = 48. Center, hinges and whiskers of the boxplots signify median, quartiles and 1.5x IQR, respectively.

