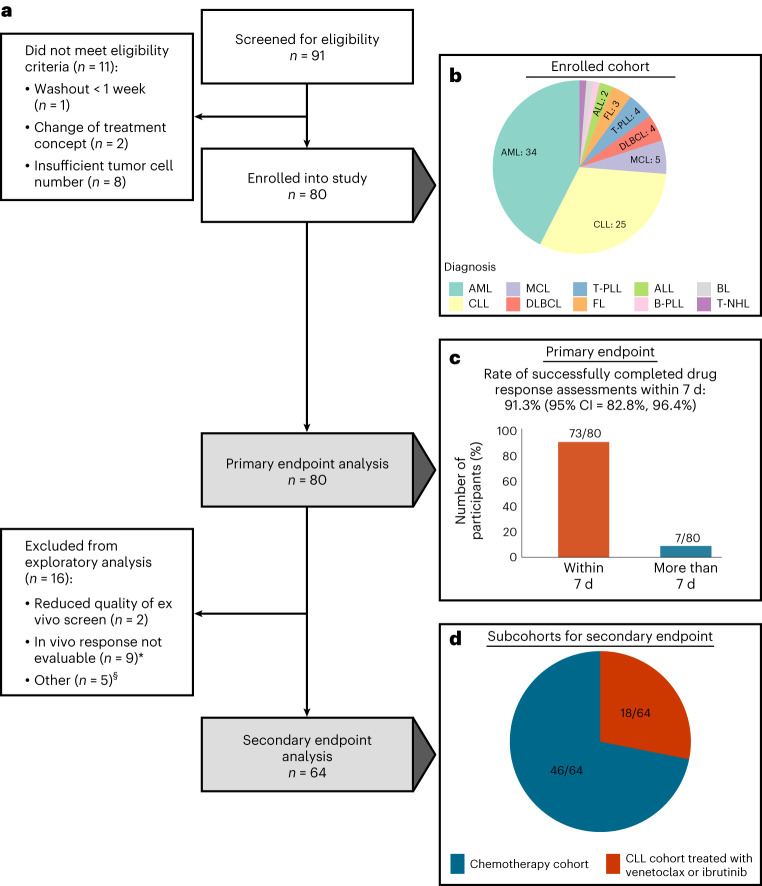
Fig. 2. Flow diagram and primary endpoint analysis.
a, Flow diagram of study participants and downstream analyses. The asterisk indicates that in nine individuals, the in vivo response was not evaluable due to the following reasons: scheduled treatment could not be initiated due to infection leading to death (n = 1), fulminant PD leading to early death (n = 1), scheduled treatment was denied by the participant before the start of treatment (n = 1) or within 14 d after treatment start (n = 1), scheduled treatment was prematurely discontinued due to side effects without prior response assessment (n = 2), scheduled treatment was discontinued several times due to side effects (n = 1) or response assessment was not available (n = 2). The section sign (§) indicates that five participants could not be assigned to the two subgroups (chemotherapy cohort and CLL cohort treated with venetoclax or ibrutinib) used for the secondary endpoint analysis. These participants were treated with palbociclib (n = 1), alemtuzumab (n = 1) and idelalisib ± rituximab (n = 2). One participant was treated with ibrutinib and rituximab but had a diffuse large B cell lymphoma. b, Enrolled participant cohort by diagnosis. c, Rate of successfully completed drug response assessments within 7 d (primary endpoint). d, Subcohorts for secondary endpoint analysis. MCL, mantle cell lymphoma; DLBCL, diffuse large B cell lymphoma; B-PLL, B cell prolymphocytic leukemia; T-NHL, T cell non-Hodgkin lymphoma.

