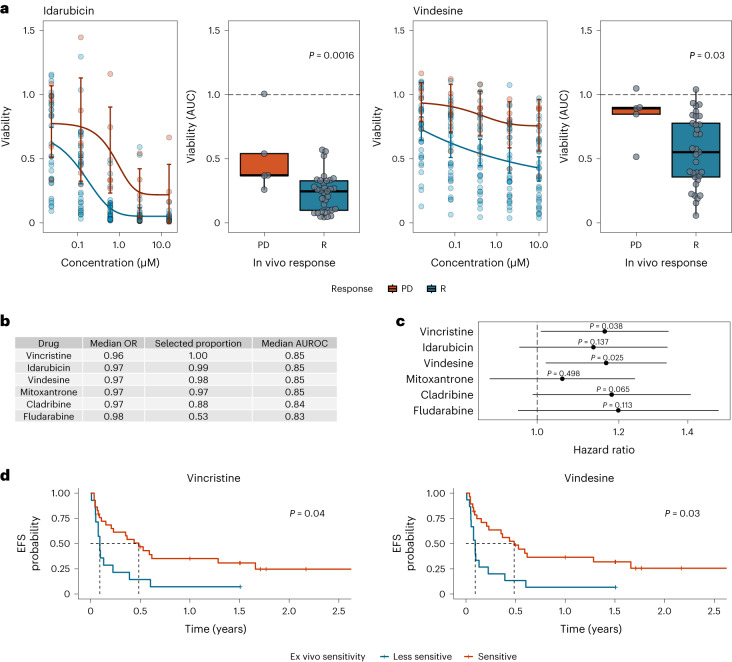
Fig. 3. Association between ex vivo drug response and in vivo response or clinical outcome.
a, Ex vivo sensitivity by clinical response group. Dose–response curves built by fitting a five-parameter logistic model using ex vivo viability measurements. Individual participant observations are displayed by circles in both plots. Blue and red represent groups of participants with clinical response (R) versus participants with PD, respectively (R: n = 33; PD: n = 5). Error bars represent mean and 95% CI. Centers, hinges and whiskers of the box plots signify medians, quartiles and 1.5× IQR, respectively. b, Elastic net logistic regression model of ex vivo drug viability (AUC) to chemotherapeutic agents with binary endpoint R versus PD (R: n = 33; PD: n = 5). The median odds ratio (OR) presented here relates to a change in ex vivo drug viability of 10%. Covariates are shown ordered by selection proportion (>0.5 shown here). The results of all covariates included in the model are shown in Supplementary Table 2. c, Association of ex vivo drug responses and EFS assessed by univariate Cox regressions (R: n = 33; SD: n = 5; PD: n = 5). Estimated hazard ratios with corresponding 95% CIs are shown. Ex vivo drug viability (AUC) was calculated per drug and scaled such that a unit change of the regressor corresponds to a 10% change in cell viability. P values are from two-sided Wald tests on Cox regression models. d, Kaplan–Meier plots for EFS stratified by ex vivo drug response to vincristine and vindesine (R: n = 33; SD: n = 5; PD: n = 5). Participant groups of ex vivo responders and weak responders were defined by ex vivo drug responses dichotomized using maximally selected log-rank statistics to visualize effects. Fourteen of 43 participants were classified as vincristine weak responders, and 15 of 43 participants were classified as vindesine weak responders.

