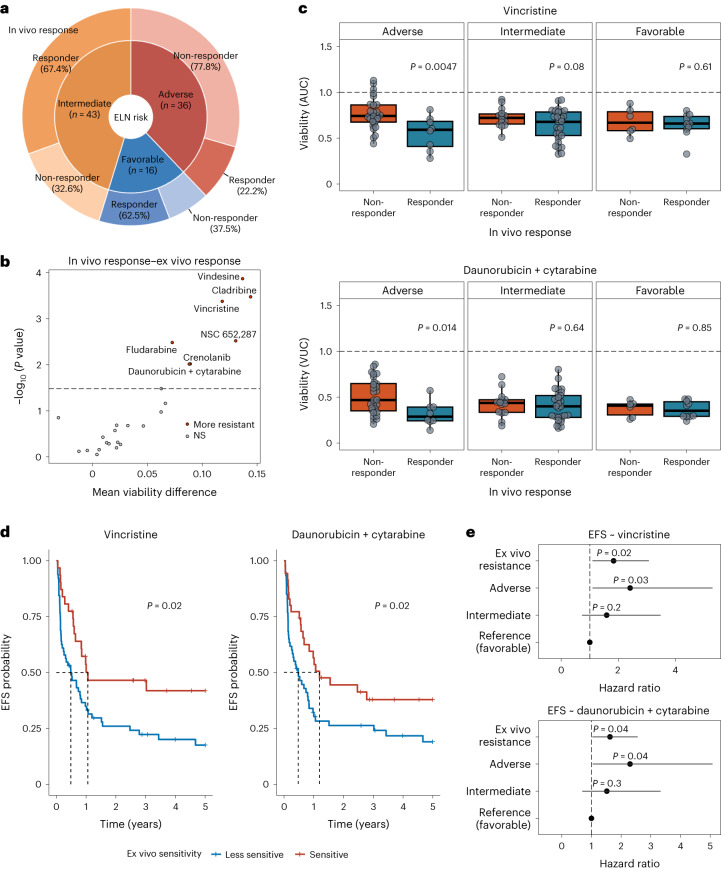
Fig. 4. Validation of the association between ex vivo and in vivo drug responses in a cohort of individuals with AML.
a, Overview of the validation cohort. The inner circle represents ELN-22 risk groups in total numbers, and the outer circle represents the distribution of in vivo responders and non-responders in ELN-22 risk groups. b, Ex vivo treatments with significantly different responses in in vivo responders (n = 47) and non-responders (n = 48). Negative log10 (P value) of Student’s t-tests is shown on the y axis, and mean difference between responders and non-responders is on the x axis. The dashed line represents the 10% false discovery rate cutoff (Benjamini–Hochberg procedure); NS, not significant. c, Viability (AUC) after ex vivo treatment with vincristine (top) and viability (volume under the curve (VUC)) after treatment with daunorubicin and cytarabine (bottom) separated by ELN-22 risk groups (ELN-22 adverse risk: non-responder: n = 28, responder: n = 8; ELN-22 intermediate risk: non-responder: n = 14, responder: n = 29; ELN-22 favorable risk: non-responder: n = 6, responder: n = 10). P values are derived from two-sided Student’s t-tests. Centers, hinges and whiskers of the box plots signify medians, quartiles and 1.5× IQR, respectively. d, Kaplan–Meier plots for EFS stratified by ex vivo drug response to vincristine and daunorubicin + cytarabine. For visualization purposes, participant groups of ex vivo responders and weak responders were defined by ex vivo drug responses dichotomized using maximally selected log-rank statistics to visualize effects. Sixty-four of 95 participants were classified as vincristine weak responders. Sixty of 95 participants were classified as daunorubicin + cytarabine weak responders. P values are from two-sided Wald tests on Cox regression models using drug responses as continuous variables. e, Forest plot of hazard ratios in multivariate Cox proportional hazards models for EFS including ELN-22 risk groups and viability after ex vivo treatment with vincristine (top) and daunorubicin + cytarabine (bottom). The ex vivo responses (AUC values) were centered by mean and scaled by 2 s.d. to bring them to a similar scale as the categorical ELN-22 risk group variables.

