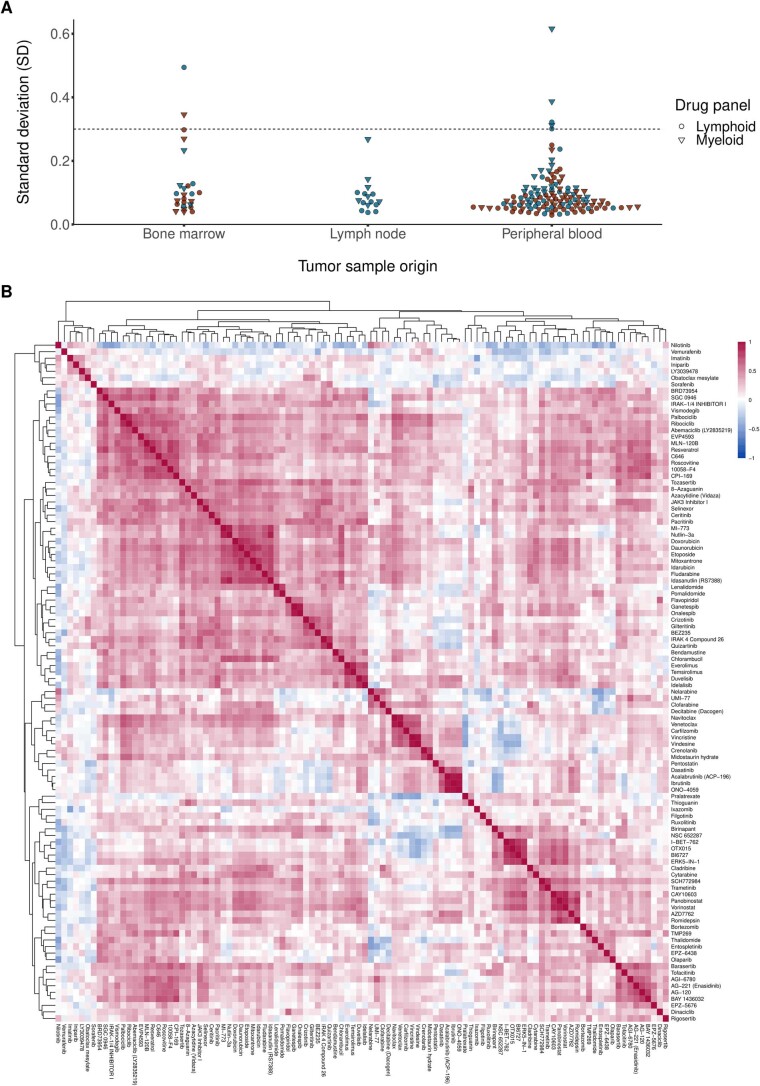
Extended Data Fig. 1. Quality assessment of SMARTrial cohort.
(a) To estimate the technical variability of the performed assay, we calculated the standard deviation (SD) of all 16 inner DMSO controls for each individual drug plate per patient. Plates with a relatively high technical noise (SD of negative DMSO controls >0.3) were excluded from further analyses (excluded myeloid plates: S047, S050, S056, S062; excluded lymphoid plates: S047, S050, S062). For two patients (S047, S062), no additional tumor material was available for retesting and they were completely excluded from the subsequent analyses. (b) The heatmap shows the drug-drug correlations for all pairs of drugs. All patients with an evaluable drug response profiling were included (n = 78, exclusion of two patients with samples with relatively high technical noise). Pearson correlation coefficients were calculated from all ex vivo drug responses, measured as AUC of all concentrations per drug. Drug pairs with high correlation and anti-correlation are represented by red and blue squares, respectively. Drugs with similar mechanism strongly correlate with each other, for example BTK inhibitors: ibrutinib, tirabrutinib (ONO-4059), and acalabrutinib.

