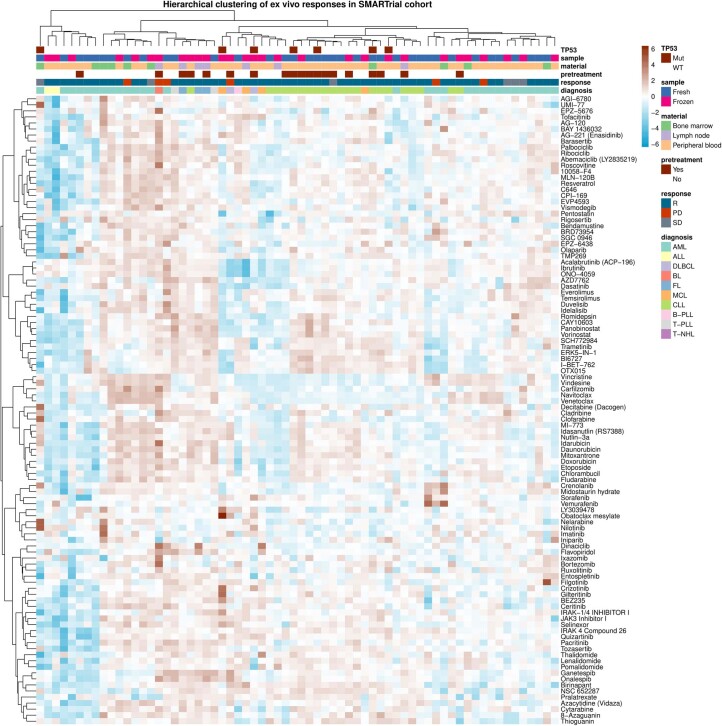
Extended Data Fig. 3. Drug response heatmap – SMARTrial.
Heatmap showing ex vivo viability measurements after drug treatment for the SMARTrial cohort. The data are shown on a robust z-score scale, that is, the logarithm of the relative viability measurements was scaled by the median absolute deviation within each row. Red indicates increased viability, and blue indicates decreased viability. Samples are annotated for diagnosis, in vivo response, pre-treatment status, material type and TP53 mutation. n = 78.

