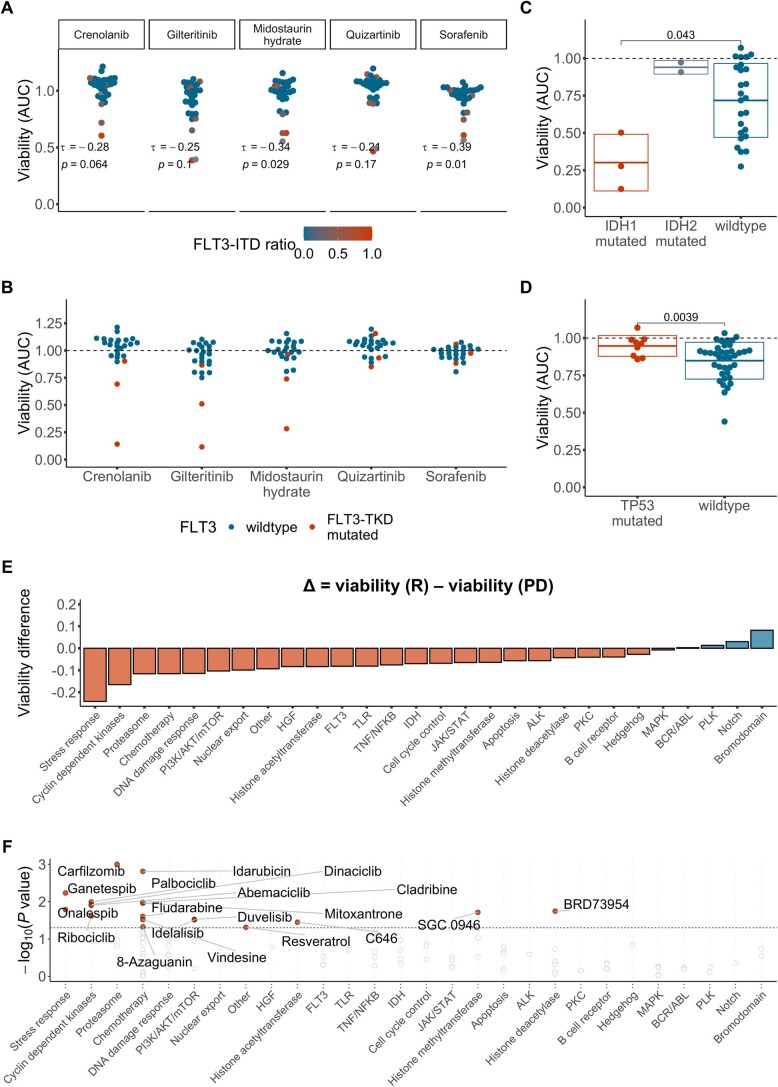
Extended Data Fig. 5. Association of ex vivo drug response phenotypes with genotype and clinical response groups.
(a) Ex vivo drug responses to FLT3 inhibitors in AML samples (n = 27, excluding AML with FLT3 TKD mutation or missing FLT3 status). Kendall’s Tau for the correlation of ex vivo drug response and FLT3-ITD ratio shown. Ex vivo response calculated as averaged normalized viability across the 2 lowest concentrations. (b) Ex vivo response to FLT3 inhibitors in AML by FLT3-TKD mutation status (n = 24, excluding AML with missing FLT3 status or a FLT3-ITD mutation). Ex vivo response calculated as averaged normalized viability across the 2 lowest concentrations. (c) Ex vivo drug response to venetoclax in AML samples by IDH mutation status (n = 28, excluding AML with missing IDH status). Ex vivo response calculated as viability (AUC) across 5 concentrations. (d) Ex vivo drug response to nutlin-3a by TP53 mutation status (n = 42, SMARTrial samples from all entities, excluding samples with a missing TP53 status). (C + D) Each dot represents one patient sample, the boxes show mean +/− standard deviation. P value from two-sided Student’s t-test. Ex vivo response calculated as viability (AUC) across all 5 concentrations. (e) Ex vivo viability (AUC) per patient averaged by pathway and mean viabilities per pathway compared between chemosensitive patients (Clinical response (R): n = 34) and chemorefractory patients (Progressive disease (PD): n = 7) shown. Bars indicate mean viability difference between response groups. Red and blue indicates reduced and increased viability in chemosensitive samples, respectively. The bars are arranged by effect size and direction. (f) Significance in individual drug effect size between the clinical response groups. Student’s two sample t-tests were performed using ex vivo drug viability (AUC) between chemosensitive patients (Clinical response (R): n = 34) and chemorefractory patients (Progressive disease (PD): n = 7). The y axis shows the negative logarithm of the P values. Drugs are grouped by pathway and averaged effect size of the pathway group. P values smaller than the significance threshold (α = 0.05) are labeled.

