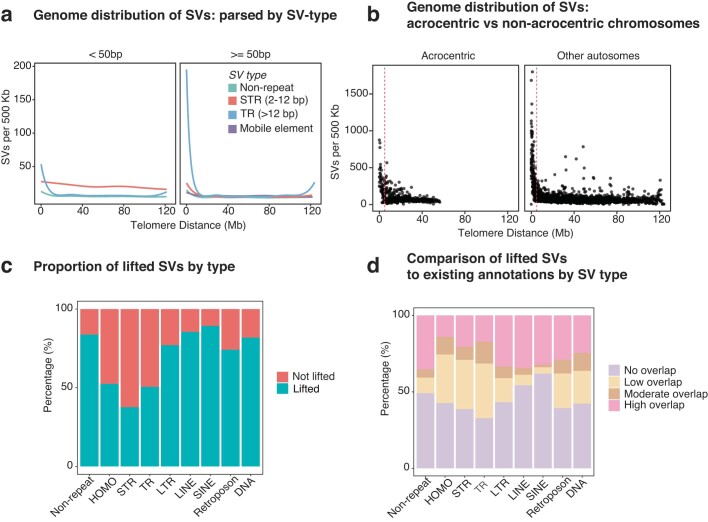
Extended Data Fig. 4. Genomic distribution and classification of structural variants.
(a) Line plots show LOESS curves of the number of large indels (> 20 & <50 bp) and structural variants (≥ 50 bp) per 500 Kb fixed window relative to the distance to the nearest telomere, parsed by variant type (non-repetitive = teal, short tandem repeat = red, tandem repeat = blue & mobile element = purple). (b) Dot plots show the number of structural variants per 500 Kb fixed window, relative to the distance of the window to the nearest telomere, for acrocentric and metacentric autosomes. The vertical dashed lines indicate a distance of 5 MB from the telomere. (c) Bar chart shows the proportion of SVs that could be lifted (green) or not (orange) from T2T-chm13 to hg38. (d) Bar chart shows the proportion of SVs classified according to reciprocal overlap as high (>80%; pink), moderate (50-80%; brown), low (<50%; beige) or no overlap (purple) in comparison to reference databases (gnomAD, deCODE & HGSVCv4; see Fig. 2e), parsed by SV type.

