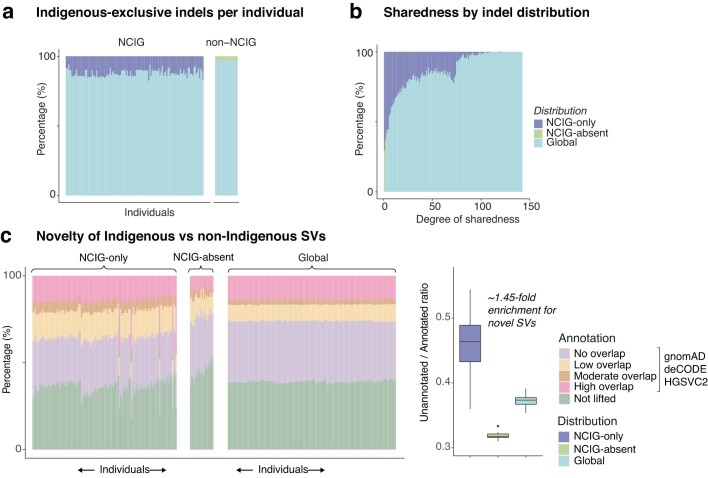
Extended Data Fig. 6. Population distribution and annotation of large indels and structural variants.
(a) Bar chart shows the proportion of large indels in each individual that were only found in NCIG individuals (NCIG-only = purple), only found in non-NCIG individuals (NCIG-absent = green) and found in both NCIG & non-NCIG individuals (Global = light blue). (b) Bar chart shows the proportion of NCIG-only, NCIG-absent and Global large indels (same colour scheme as Fig. 3a) for all the variants identified within a given number of individuals in the cohort (degree of sharedness). (c) Proportion of NCIG-only, NCIG-absent or Global SVs in each individual that were previously annotated in gnomAD, deCODE or HGSVCv4 SV catalogs (see Fig. 2e). Accompanying boxplot shows the distribution of ratios between the proportion of SVs ‘unannotated’ (high & moderate overlap) to the proportion of SVs ‘annotated’ (low and no overlap) against at least one of the databases. A total of n = 141 individuals (NCIG-only = 121, NCIG-absent = 20 and Global = all individuals) were examined from independent sequencing experiments in figure c. In the boxplot, the middle line is the median, the box represents the interquartile range (IQR), the whiskers extend 1.5 times the IQR from the hinge, and any data points beyond the whiskers are shown individually.

