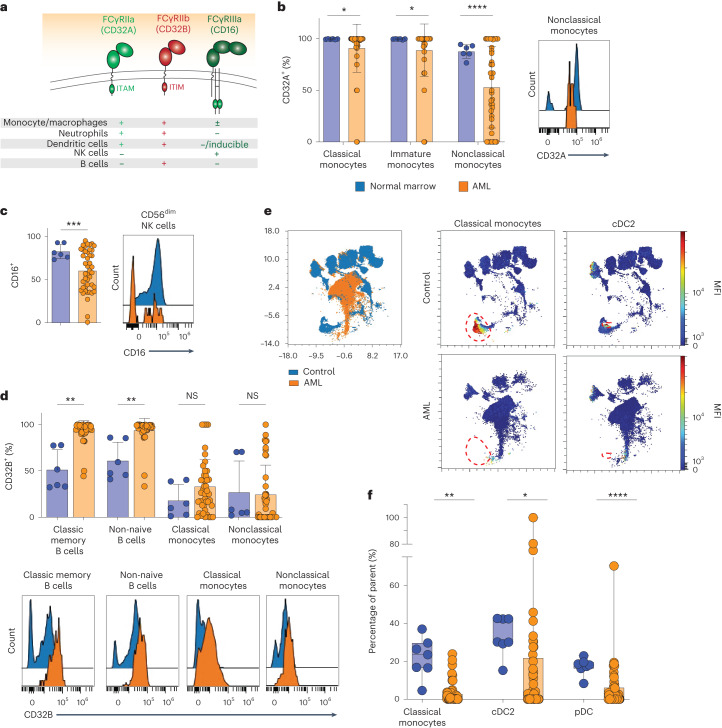
Fig. 3. Alterations in frequencies and distribution of Fc receptor expression on immune cell subsets in the bone marrow microenvironment of patients with AML.
a, Schematic summary of FcγR expression across normal immune cell subsets. ITAM, immunoreceptor tyrosine-based activating motif; ITIM, immunoreceptor tyrosine-based inhibitory motif. b, Expression of activating receptor CD32A on monocyte populations in AML bone marrow (orange, n = 44 patients) compared to bone marrow from unaffected donors (blue, left, n = 6 donors) and representative flow cytometry histogram of CD32A expression on AML nonclassical monocytes (orange) compared to controls from unaffected donors (blue, right); P values are from Welch’s unpaired t-test. *P = 0.0182 (classical monocytes), *P = 0.0193 (immature monocytes), ****P < 0.0001 (left). c, Expression of activating receptor CD16 on CD56dim NK cells in AML bone marrow (n = 44 patients) compared to bone marrow from unaffected donors (left, n = 6 donors) and a representative flow cytometry histogram (right); P values are from Welch’s unpaired t-test. ***P = 0.0002 (left). d, Inhibitory receptor CD32B on B cells and monocytes in AML bone marrow (n = 44 patients) compared to bone marrow from unaffected donors (n = 6 donors) (top) and representative flow cytometry histograms (bottom); P values are from Welch’s unpaired t-test. **P = 0.0048 (classic memory B cells) and 0.0094 (non-naive B cells) (top). NS, not significant. e, Representative UMAP overlay generated from the 36-color spectral flow cytometry panel comparing normal bone marrow (blue) and AML bone marrow (orange, left) and individual representative UMAPs depicting classical monocyte and cDC2 cell populations (each demarcated with a red outline) in an unaffected control donor (top) compared to a patient with AML (bone marrow) in whom these populations are absent (bottom). f, Quantification of classical monocytes and cDC2 cells in AML bone marrow (n = 49) compared to bone marrow from control donors (n = 7 donors); P values are from Welch’s unpaired t-test. **P = 0.0028 (classical monocytes), **P = 0.0014 (cDC2) and ****P < 0.0001 (pDC). Data are mean ± s.e.m.

