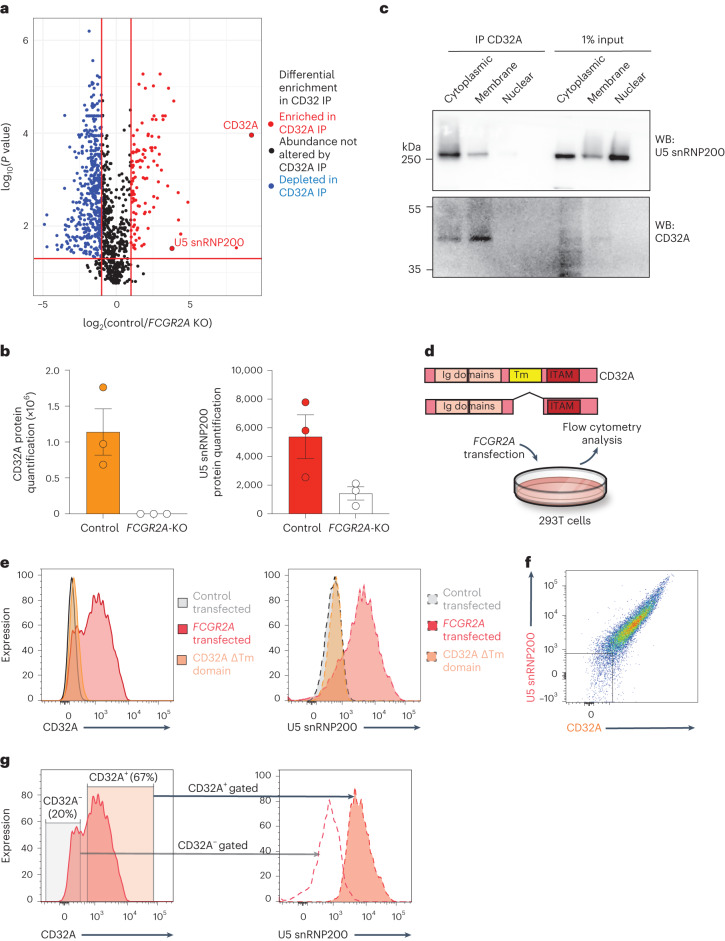
Fig. 6. Physical interaction of CD32A and U5 snRNP200 at the AML cell membrane and requirement of the CD32A transmembrane domain for U5 snRNP200 surface membrane localization.
a, Volcano plots of proteins differentially enriched in immunoprecipitation of CD32A from the membrane followed by mass spectrometry from wild-type versus knockout K562 cells. Proteins displayed were identified in FCGR2A-wild-type versus FCGR2A-knockout cells in triplicate, and values displayed are the mean of triplicate results. P values were derived by two-sided t-test, and P values were adjusted for multiple comparisons. b, Quantification of CD32A (left) and U5 snRNP200 (right) from immunoprecipitation–mass spectrometry of membrane-bound CD32A from FCGR2A-wild-type versus FCGR2A-knockout K562 cells. Each value represents data from a single mmunoprecipitation–mass spectrometry experiment with three biological replicates. c, Immunoprecipitation of CD32A followed by western blot in the cells from a. Representative of three independent experiments. d, Schematic of experiments to test the requirement of CD32A and its transmembrane (Tm) domain in the cell surface localization of U5 snRNP200 in 293T cells. e, Histograms of CD32A (left) and U5 snRNP200 (right) in 293T cells transfected with control, FCGR2A-wild-type cDNA or FCGR2A cDNA with in-frame deletion of the sequence for the transmembrane domain (‘CD32A ΔTm domain’). f, Representative flow cytometry plot of CD32A versus U5 snRNP200 surface expression in 293T cells transfected to express CD32A. g, Cell surface expression of U5 snRNP200 (right) in the cells from d gated on low versus high CD32A-expressing cells (left). Data are mean ± s.e.m.

