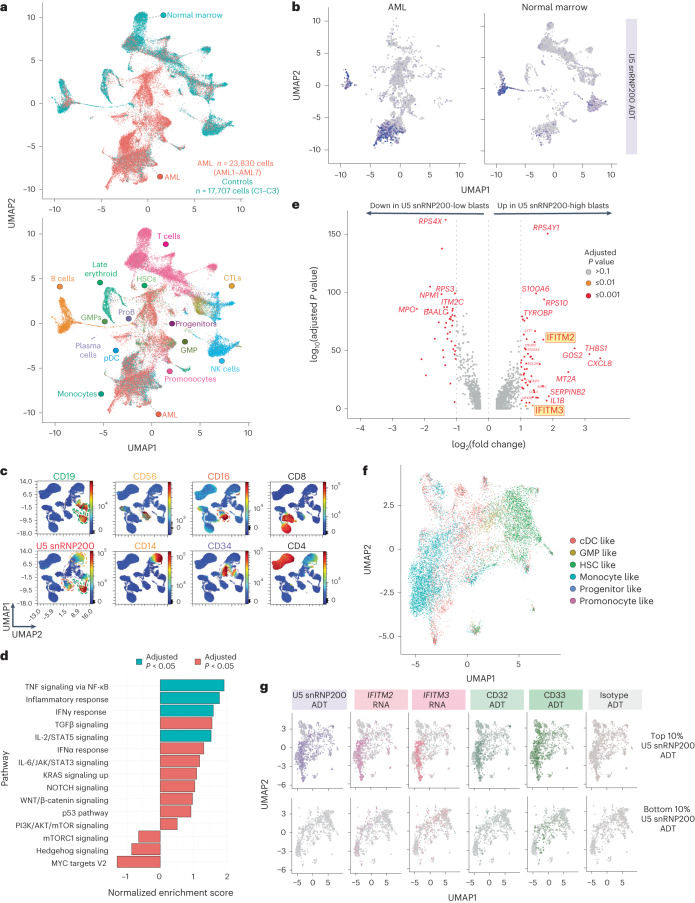
Fig. 7. Unbiased evaluation of cell surface U5 snRNP200 expression in normal and malignant hematopoietic cells and transcriptional characteristics of cell surface U5 snRNP200-expressing AML cells.
a, Multimodal UMAP projection delineating cell populations originating form normal and malignant AML bone marrow samples (top) and cell type labels (bottom). CTL, cytotoxic T lymphocytes; proB, pro-B cells. b, Representative U5 snRNP200 ADT colorimetric overlay on AML (left) and control donor (right) bone marrow cell populations. c, Representative UMAPs generated from the custom 36-parameter spectral flow cytometry panel displaying cell populations in control bone marrow. Heatmap colors indicate relative antigen expression intensity. Dashed lines indicate cell island subsets for comparison of surface U5 snRNP200 expression (bottom left): CD19+ B cells, green; CD56+ NK cell subset, yellow; CD16+ NK cell subset, red; CD14+ monocyte subset, orange; CD34+ HSCs, purple). d, Pathway enrichment observed in high U5 snRNP200-surface expressing AML cells. Enrichment score was calculated for a given gene set using log2-transformed fold change ranking when comparing U5 snRNP200-high versus U5 snRNP200-low populations and then normalized by the size of that gene set. To identify the P value, 1,000 random gene sets were generated, and an enrichment score was calculated for each of them. The P value was estimated as the number of random gene set enrichment scores with the same or more extreme values divided by the total number of randomly generated gene sets. For the adjusted P value, the Benjamini–Hochberg procedure was used. e, Differential gene expression in high versus low U5 snRNP200-surface expressing AML cells. P values were identified by two-sided implementation of the Wilcoxon rank-sum test. The P value was adjusted for multiple testing using Bonferroni correction. f, Dedicated AML cell UMAP depicts distinct proteogenomic subsets. g, Colorimetric overlay of surface expression of U5 snRNP200, CD33 and CD32 ADT signals along with IFITM2 and IFITM3 mRNA expression in the top 10% highest (top) and bottom 10% lowest or negative (bottom) U5 snRNP200-surface expressing AML cells.

