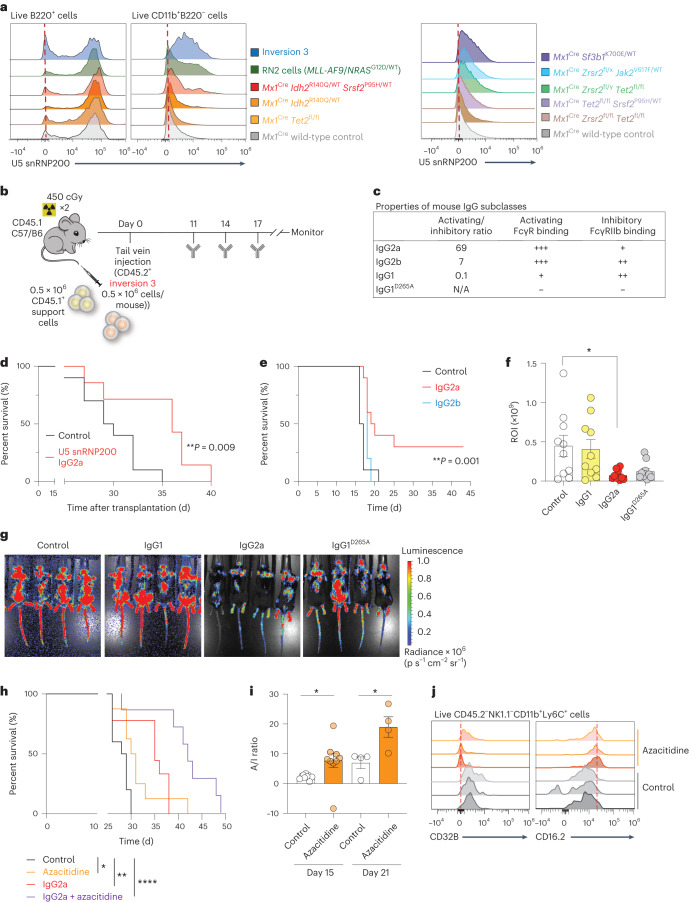
Fig. 8. Anti-U5 snRNP200 antibodies with high affinity for FcγRs demonstrate robust anti-leukemic effects.
a, Histogram overlays of U5 snRNP200 surface expression on peripheral blood B cells (left) and malignant myeloid cells (middle and right) by flow cytometry in murine genetically engineered models of AML. b, Schema of mouse inversion 3 AML model transplantation and treatment schedule. c, Table describing mouse IgG Fc subclass binding to activating and inhibitory Fc receptors. N/A, not applicable. d, Kaplan–Meier survival curve of recipient mice engrafted with inversion 3 AML cells following treatment with anti-U5 snRNP200 antibody engineered with the IgG2a Fc subclass (n = 7) or control (PBS) (n = 10). P values are from the log-rank test. e, Kaplan–Meier survival curve of recipient mice engrafted with mouse RN2 (MLL-AF9 overexpression and NRASG12D mutation) cells following treatment with anti-U5 snRNP200 antibody engineered with IgG2a Fc, IgG2b Fc or control. P values are from the log-rank test. **P = 0.0012 (n = 10 mice per group). f, Quantification of bioluminescent imaging comparing RN2 disease burden on day 14 among control mice and mice treated with anti-U5 snRNP200 antibody (n = 10 mice per group). P values are from the unpaired t-test; *P = 0.0204. ROI, region of interest. g, Representative images of bioluminescent signal (measured on day 14) in control mice and mice treated with anti-U5 snRNP200 antibody. h, Kaplan–Meier survival curve of recipient mice engrafted with inversion 3 AML cells following treatment with anti-U5 snRNP200 antibody engineered with the IgG2a Fc subclass or control with or without concomitant azacitidine treatment. P values are from the log-rank test; *P = 0.0110, **P = 0.0035, ****P < 0.0001. i, Fc receptor activating/inhibitory (A/I) ratios (CD16.2/CD32B) on peripheral blood CD45.2− monocytes or macrophages after 5 days of in vivo control or azacitidine treatment in inversion 3-engrafted mice (day 15, n = 9 mice per group; day 21, n = 4 mice per group). P values are from the unpaired t-test; left, *P = 0.036; right, *P = 0.023. j, Representative expression histograms from individual mice in i. Data are mean ± s.e.m.

