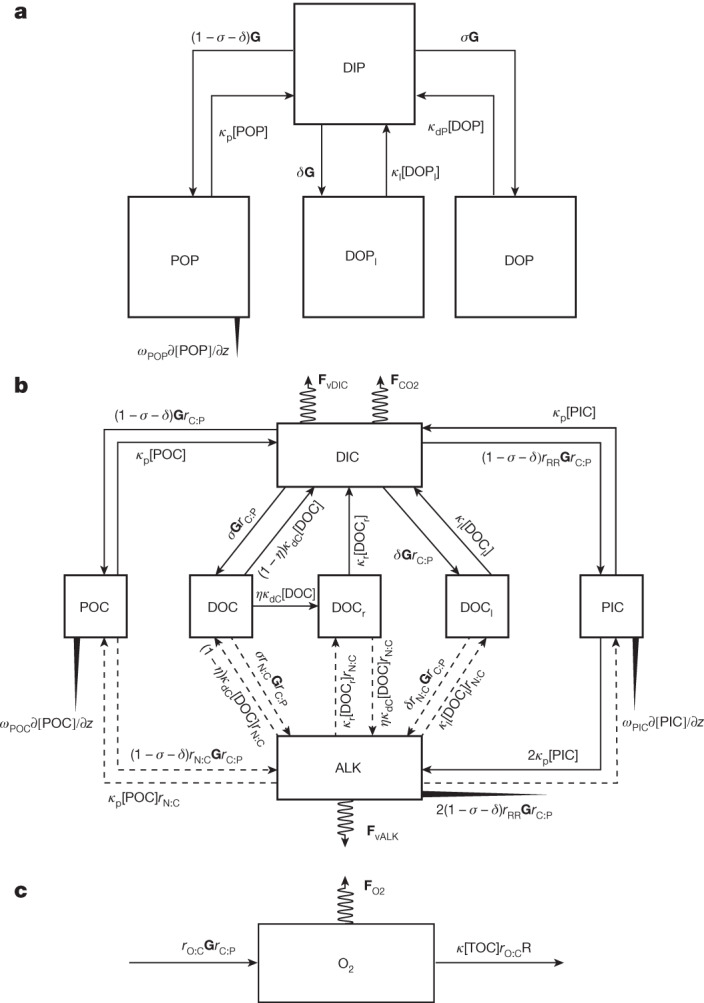
Fig. 1. Schematic representations of phosphorus, carbon and oxygen cycling in the ocean.

a, Phosphorus cycling. b, Carbon cycling. c, Oxygen cycling. The dissolved tracers, oxygen (O2), DIP and DIC, DOP and DOC, and ALK are transported by advection and diffusion. POP and POC are transported vertically downward and remineralized in the water column. The downward particulate flux attenuation is modelled so as to produce a power-law depth dependence. PIC also sinks and dissolves in the water column. Its downward flux attenuation is modelled so as to produce an exponential depth dependence. DIC and O2 experience sea-to-air gas fluxes in the surface ocean, which are represented by the coiled arrows above DIC and O2, respectively (FCO2 and FO2). The DIC and ALK concentrations are influenced by evaporation and precipitation. Thus, a virtual flux (coiled arrows above DIC and below ALK; FvDIC and FvALK, respectively) is applied to DIC and ALK to account for the concentrating and diluting effects of precipitation and evaporation. The solid lines in the schematic for the carbon-cycle model represent the pools that are connected by means of sink–source relationships. The dashed lines indicate the pools that are related by indirect source–sink relationships. For example, the formation of POC does not directly release ALK but instead changes the chemical form of nitrogen, which leads to changes in the ALK. See Methods for the symbol definitions and the Supplementary Information for their numerical values. κ[TOC] in the O2 model represents the remineralization of TOC (see Methods for its full expression).
