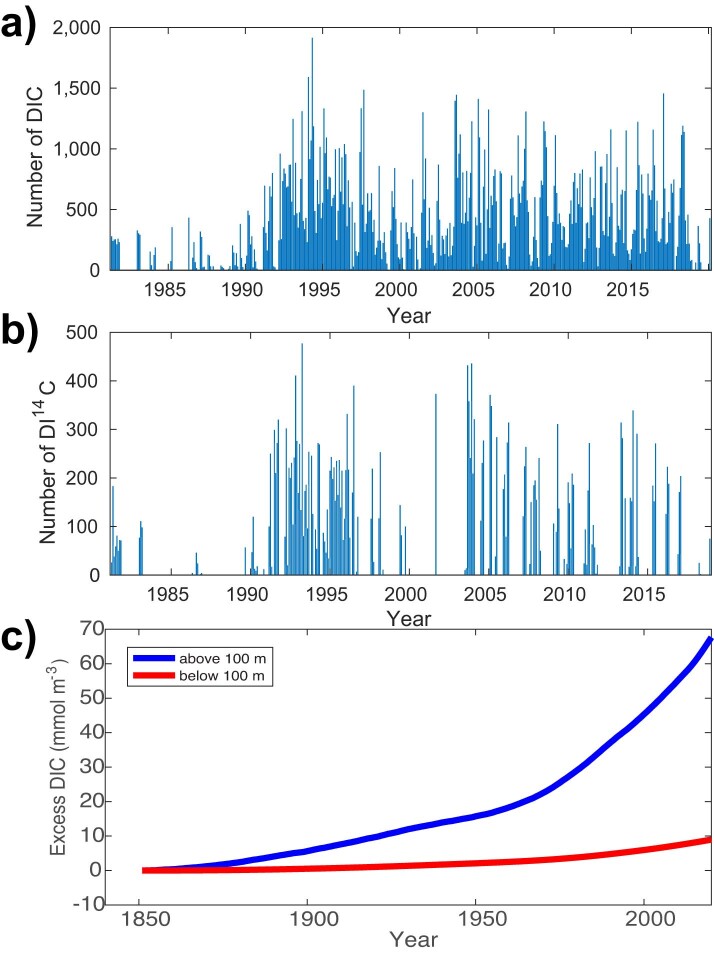
Extended Data Fig. 5. DIC and DI14C observations.
a, Number of hydrographic DIC measurements per month in the GLODAPv2 database as a function of time. b, Number of hydrographic δ14C measurements per month in the GLODAPv2 database as a function of time. c, Estimated excess DIC (DIC(t) − DIC(1850)) computed by averaging the DIC concentration of our optimized model over the top 100 m (blue) and below 100 m (red). For reference, the estimated average background DIC concentration in 1850 was 2,046.8 mmol m−3 for the top 100 m of the water column and 2,308.4 mmol m−3 for the water column below 100 m, implying a reduction in the vertical DIC gradient of approximately 20% owing to the invasion of anthropogenic CO2 into the ocean. This reduction masks the true strength of the biological pump, unless it is properly accounted for in the model.

