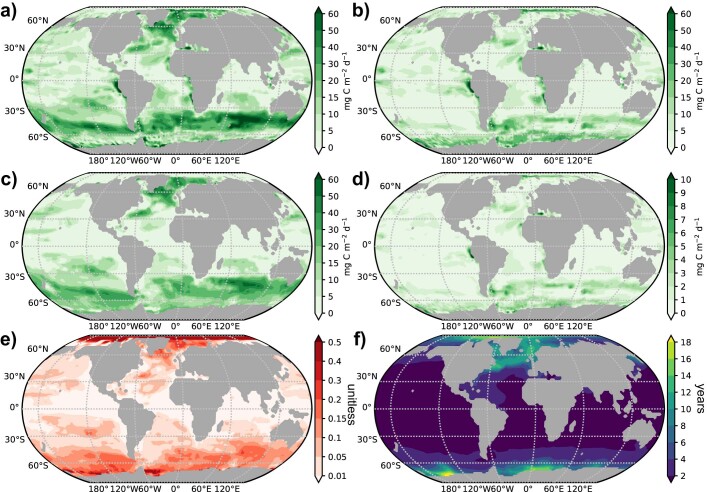
Extended Data Fig. 9. Distributions of standard deviations.
a, Standard deviations of TOC flux. b, Standard deviations of non-advective-diffusive flux. c, Standard deviations of advective-diffusive flux by labile DOC. d, Standard deviations of advective-diffusive flux by semi-labile DOC. e, Standard deviations of the ratio of advective-diffusive flux to TOC flux. f, Standard deviations of DOC residence time in years. These standard deviations are computed from four distinct model configurations, which hinge on two distinct NPP products, namely, CbPM and CAFE, along with two varying e-folding remineralization timescales for labile DOC, specifically, 12 h and 24 h.

