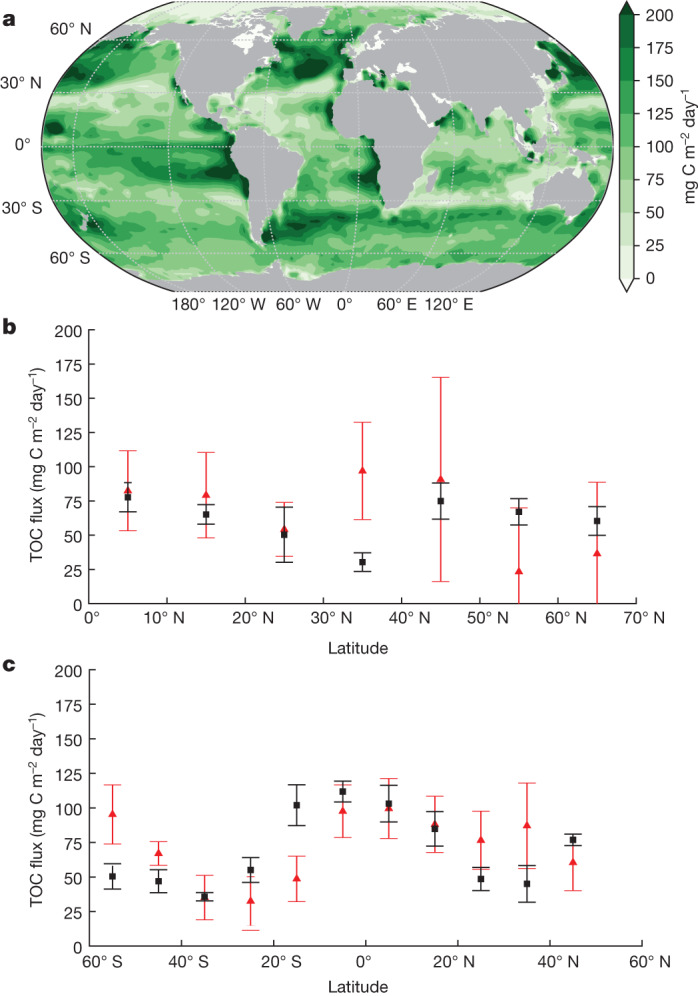
Fig. 4. TOC flux at the base of the model euphotic zone.

a, Distribution of TOC (non-advective-diffusive + advective-diffusive) flux (mg C m−2 day−1) at the base of the euphotic zone. b,c, Comparisons of TOC flux with geochemical ANCP estimates at the North Atlantic and Pacific oceans, respectively. The black squares represent the mean (±1σ) of TOC flux over 10° latitude bands in this study. The red triangles correspond to the mean (±1σ) of geochemical ANCP estimates33, which is computed at the base of a spatially varying mMLD obtained from a CESM simulation. For a fair comparison, we extend our flux to the bottom of mMLD at places in which mMLD is deeper than the model euphotic zone depth (Methods). Our TOC flux is the sum of non-advective-diffusive and advective-diffusive flux at places in which mMLD is shallower than the euphotic depth. The results are based on the CbPM NPP product and an e-folding remineralization time of 12 h for labile DOC.
