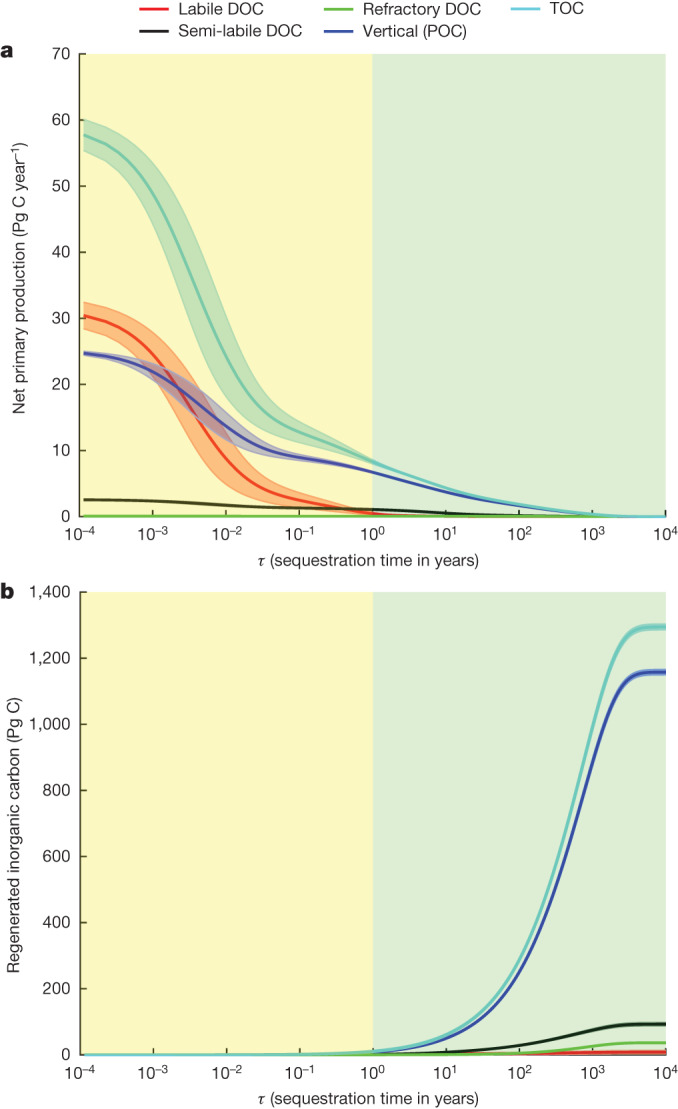
Fig. 5. Sequestration-time distribution functions for the organic carbon flux and the stock of regenerated DIC.

a, Sequestration-time-partitioned organic carbon production. The curves show the cumulative NPP fluxes with sequestration times greater than τ separated into contributions from labile DOC (red), semi-labile DOC (black), refractory DOC (green) and POC (blue). The sequestration times are measured from the time when the organic carbon is respired into DIC to the time when the regenerated DIC is transported back to the 36.1-m-thick surface layer of the model. b, Sequestration-time-partitioned standing stock of regenerated DIC. The curves show the cumulative stock with sequestration times less than τ. All curves correspond to climatological-mean estimates integrated over the whole ocean volume. The error bars, indicated by the shaded regions, correspond to ±1σ computed from four inverse models in which the e-folding lifetime of labile DOC was either 12 h or 24 h and the biological carbon production was patterned using either the CbPM or the CAFE NPP products. The posterior parametric uncertainty makes a negligible contribution to the shown error bars. For τ > 1 year (green regions), the inverse model produces a robust estimate of the export-flux distribution.
