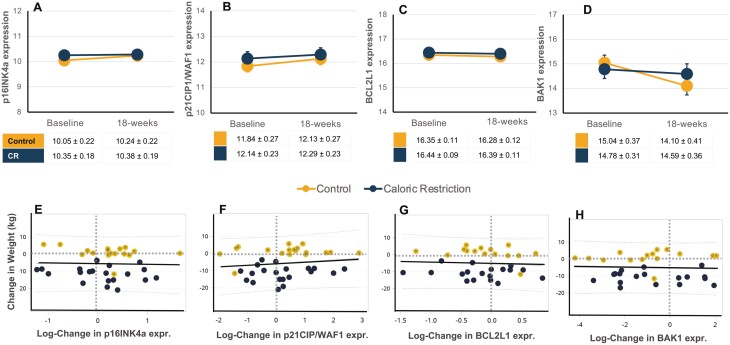
Figure 1.
Intervention effect on circulating T-cell expression of biomarkers of cellular senescence and apoptosis. Individual data points and mean ± SEM data are shown at baseline and 18-week postintervention of caloric restriction (CR, blue) or health education control (Control, orange) for CD3 + T-cell gene expression of log-transformed markers of cellular senescence p16INK4a (A), and p21CIP1/WAF1 (B), apoptosis marker BCL2L1 (C), and anti-apoptosis marker BAK1 (D). Estimated means and SEM are shown in tables; mixed models adjusted for age, sex, and race were performed. Simple linear regression model with R2-values for log-fold change in gene expression with change in body with intervention in CR (blue) or Control (orange) groups for p16INK4a (E), p21CIP1/WAF1 (F), BCL2L1 (G), BAK1 (H). No significant changes or between group effects were observed. CR = Caloric restriction; SEM = standard error of the mean.

