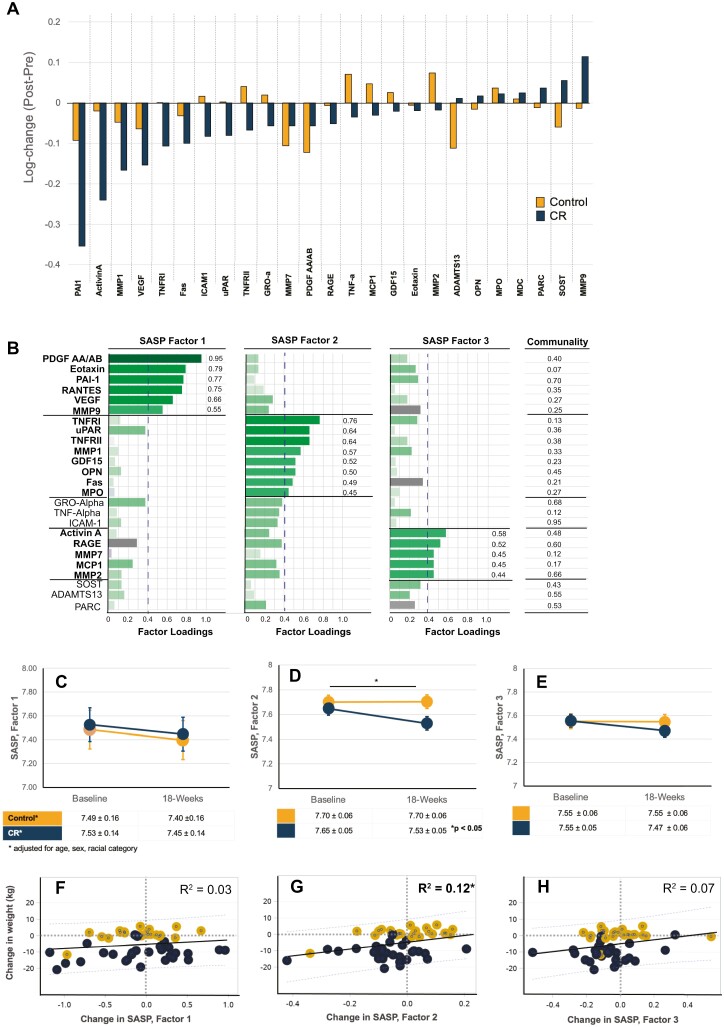
Figure 2.
Change in senescence-associated secretory phenotype (SASP) proteins with 18-week intervention of Caloric restriction (CR) or Control. (A) All data are as log-fold change in biomarker levels (post–pre) for CR (blue) or Control (orange) groups, displayed as waterfall chart with largest reduction in biomarker level with CR on the left, and largest increase with CR on the right. (B) An exploratory factor analysis using iterative principal axis factor with a Varimax (orthogonal) rotation was performed on assays prior to randomization to reduce dimensionality. The results of an orthogonal rotation of the solution are shown with three SASP Factors (note, capitalized “Factor” hereafter refers to the composite score from each of three Factors identified by iterative principal factor analysis). A conservative cut point of 0.4 for variables contributing to Factors to remain in factor analysis was used. A composite score for each Factor was calculated by averaging the values of each contributing factor determined in Panel B, for example, SASP Factor 1 score = average (PDGF AA + Eotaxin + PAI-1 + RANTES + VEGF + MMP9). Mixed models adjusted for age, sex, and race were performed, and Estimated means and SEM are shown and time × treatment interactions indicated as *p ≤ .05 for: SASP Factor 1 score (C), SASP Factor 2 score (D), and SASP Factor 3 score (E). Lower panels show simple regression models with R2 values for log-fold change in composite SASP Factors 1 (F), Factor 2 (G), and Factor 3 (H) with change in body weight in CR (blue) or Control (orange) groups.

