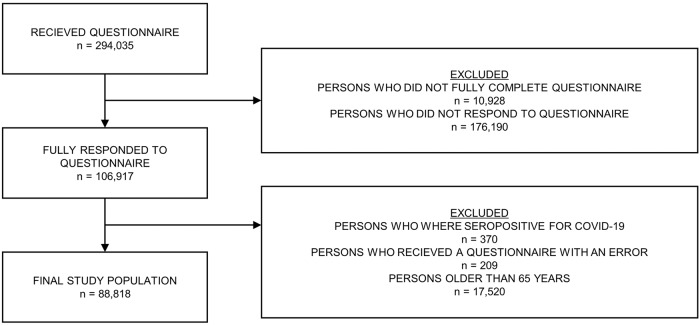
Fig. 1. Diagram illustrating the flow of persons from receiving their questionnaire to inclusion in the final study population.
The flow of persons from receiving their questionnaire (n = 294,035) to inclusion in the final study populations (n = 88,818). Persons were exluded if they did not respond fully to their questionnaire. Of those that filled out the questionnaire (n = 106,117), persons above 65 years of age, persons with a seropositive result for COVID-19, and persons who received a questionnaire with an error were excluded.

