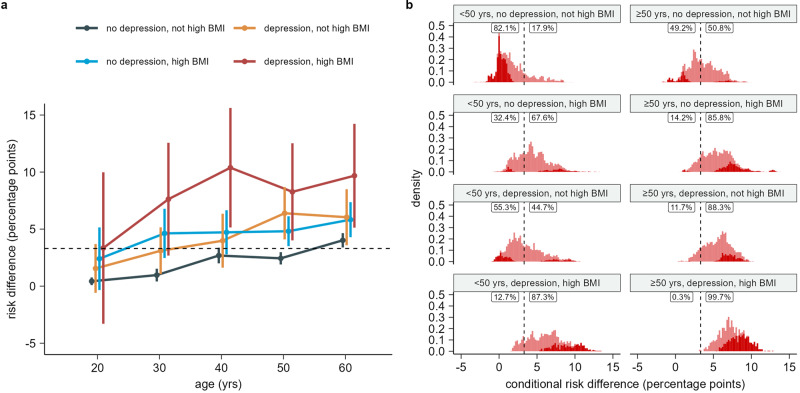
Fig. 3. Estimated risk differences for combinations of age, high BMI, and depression.
a Risk differences (RDs) and two-sided 95% confidence intervals (CI) for substantial full-time sick leave taken 4 weeks to 9 months after the test date between SARS-CoV-2 test-positives and test-negatives for subgroups of a population of n = 88,818 individuals. Subgroups are defined by combinations of age, high BMI, and depression risk factors. Subgroups with unknown BMI (n = 6823) are not displayed. b Distribution of conditional risk differences (CRDs), estimated using out-of-bag prediction from the causal forest model, within subgroups of a population of n = 88,818 individuals. Subgroups are defined by combinations of age, high BMI, and depression risk factors. Subgroups with unknown BMI (n = 6823) are not displayed. The dashed line shows the average RD in the full population. The fraction of CRDs below and above this RD is printed for each combination of age, high BMI, and depression. Dark red indicates estimated CRDs significantly different from the average RD in the full population at a 5% significance level using a z-test with two-sided alternative.

