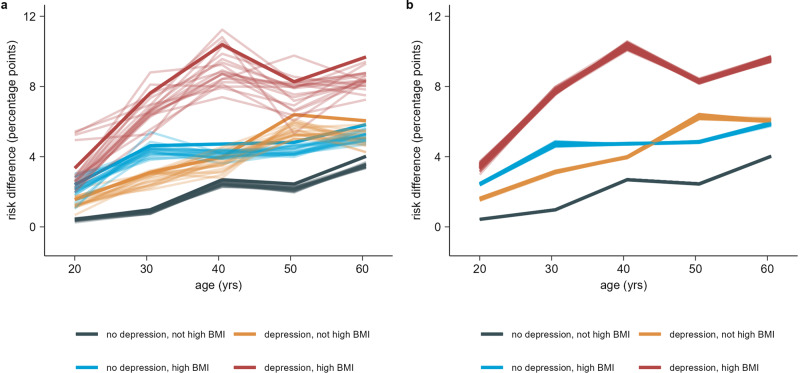
Fig. 5. Sensitivity analyses - Estimated risk differences for combinations of age, high BMI, and depression.
a Risk differences (RDs) for substantial full-time sick leave taken 4 weeks to 9 months after the test date between persons labelled as true positive or false negative, and persons labelled as true negative or false positive. Estimates are across subgroups of a population of n = 88,818 individuals. Subgroups are defined by combinations of age, high BMI, and depression risk factors. Subgroups with unknown BMI (n = 6823) are not displayed. The solid coloured lines show the RDs from the main analysis, while the transparent lines show the result from each analysis using a modified exposure. b Risk differences (RDs) for substantial full-time sick leave taken 4 weeks to 9 months after the test date between SARS-CoV-2 test-positives and test-negatives within subgroups of a population of n = 88,818 individuals. Subgroups are defined by combinations of age, high BMI, and depression risk factors. Subgroups with unknown BMI (n = 6823) are not displayed. The plot consists of 81 lines for each combination of depression and high BMI, each showing the result for a different combination of the hyperparameters sample fraction, mtry, minimum node size, and honesty fraction.

