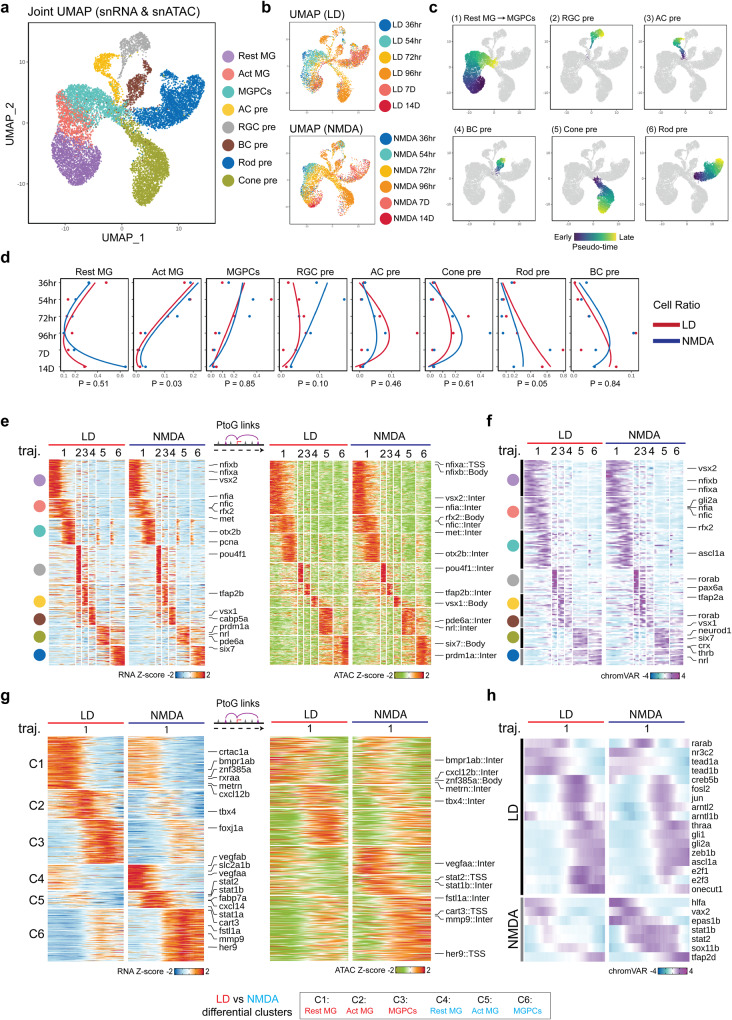
Fig. 2. Shared and differential patterns of gene expression and chromatin accessibility data observed in MG-derived cells following LD and NMDA treatment.
a, b Combined UMAP projection of Müller glia (MG) and progenitor neuron cells profiled using multiomic sequencing. Each point (cell) is colored by cell type (a) and time points (b). Resting (Rest); Activated (Act); MG-derived progenitor cells (MGPCs); amacrine cell (AC); retinal ganglion cell (RGC); bipolar cell (BC); precursor (pre). c UMAPs showing trajectories constructed from mutiomics datasets of combined light damage (LD) and NMDA datasets. Color indicates pseudotime state. d Line graphs showing the fraction of cells (x axis) at each time point (y axis) of each cell type. Lines are colored by treatment. The paired t-test were used to compare the cell fraction from LD and NMDA. p values are labeled at the bottom of the graph. e Heatmap shows the consensus marker genes and their related marker peaks (TSS and enhancer) between LD and NMDA treatment for each cell type. f Heatmap shows the consensus motifs between LD and NMDA treatment for each cell type. g Heatmap shows the differential genes and their related differential peaks (TSS and enhancer) between LD and NMDA treatment for MG (Rest), MG (Act) and MGPCs. h Heatmap shows the differential motifs between LD and NMDA treatment for MG (Rest), MG(Act), and MGPCs.

