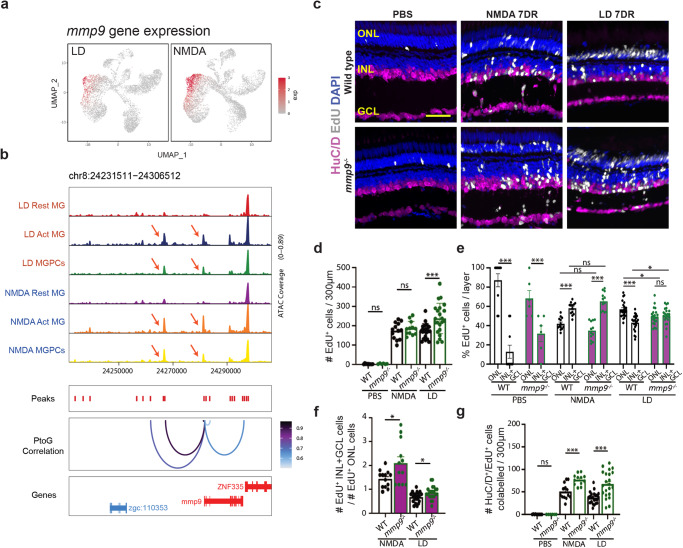
Fig. 3. Mmp9 selectively inhibits generation of inner retinal neurons from MGPCs.
a UMAP plot showing expression pattern of mmp9 in LD (light damage) and NMDA-treated retina. b Altered chromatin accessibility in putative regulatory sequences associated with mmp9 following both LD and NMDA damage. c PBS-injected control, NMDA-treated, and LD retinas at 7 days recovery (DR) immunostained with HuC/D to label retinal ganglion cells and amacrine cells, EdU, and counterstained with DAPI. Outer nuclear layer (ONL); inner nuclear layer (INL); ganglion cell layer (GCL). d Quantification of the number of EdU-labeled cells in all three retinal layers in wild-type (WT) and mmp9 mutants following either PBS injection, NMDA damage, or LD. (PBS) WT n = 10, mmp9−/− n = 6; (NMDA) WT n = 13, mmp9−/− n = 12; (LD) WT n = 23, mmp9−/− n = 22. Three replicate experiments. e The percentage of EdU-positive cells in the ONL vs. the INL + GCL is plotted for wild-type and mmp9 mutant retinas after PBS injection, NMDA damage, and light damage. (PBS) WT n = 10, mmp9−/− n = 6; (NMDA) WT n = 13, mmp9−/− n = 12; (LD) WT n = 23, mmp9−/− n = 22. Three replicate experiments. f The ratio of EdU-positive ONL cells to EdU-positive INL + GCL cells is plotted for wild-type and mmp9 mutant fish following either NMDA damage or light damage. (NMDA) WT n = 13, mmp9−/− n = 12; (LD) WT n = 23, mmp9−/− n = 22. Three replicate experiments. g Quantification of the number of cells colabelled for EdU and HuC/D in PBS-injected, NMDA-injected, and light-damaged retinas. (PBS) WT n = 10, mmp9−/− n = 6; (NMDA) WT n = 13, mmp9−/− n = 12; (LD) WT n = 23, mmp9−/− n = 22. Three replicate experiments. Magenta bars indicate data from mmp9 mutants. Scale bar in (c) is 20 μm. d–g Data are presented as mean values ± SEM. Students’ t test was performed for (d, f, g), while two-way ANOVA with Bonferroni’s post hoc test for (e). Asterisks indicate statistically significant differences between the indicated groups (*p ≤ 0.05, ***p ≤ 0.001). Source data are provided as a Source Data file 1.

