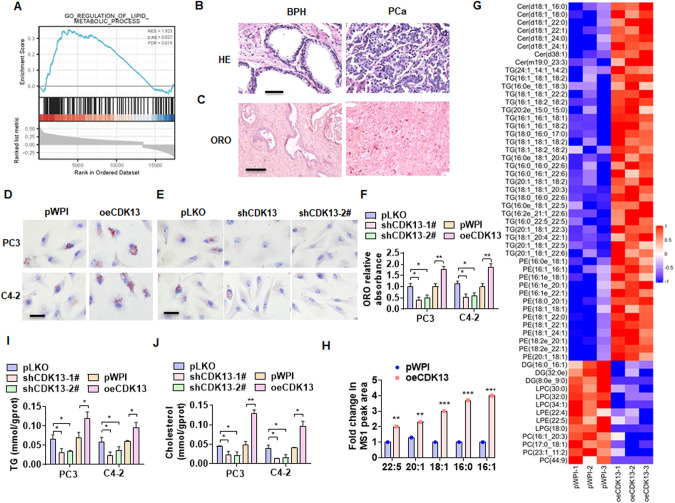
Fig. 1. CDK13 promotes fatty acid synthesis and lipid deposition in PCa cells.
A HE staining was used to detect the change of prostate histopathology in the BPH and PCa tissues. Scale bar = 50 μm. B Oil red O (ORO) staining detected lipid accumulation in the BPH and PCa tissues (n = 31). Scale bar = 100 μm. C GSEA was used to analyze lipid metabolic signaling pathways regulated by CDK13 in PCa. FDR < 0.019 and P = 0.027. D, E PC3 and C4-2 cells were transfected with CDK13-expressing vector (oeCDk13), 2 individual shRNAs targeting different regions of the CDK13 gene (shCDK13-1#, shCDK13-2#) or their corresponding control vectors, and then ORO staining was performed to detect lipid deposition in the cells. Scale bar = 20 μm. F Quantitative analysis of Oil Red O staining in (D) and (E). G Lipidomics analysis by LC/MS was performed to examine lipid components in PC3 cells with and without stable overexpression of CDK3 (n = 3). Heatmap showing lipid molecules with significant change, represented by red (upregulated) and green (downregulated). H A statistically significant increase in abundance of fatty acyl chains in CDK13-overexpressing cells. I, J TG and cholesterol contents were measured as quantitative indicators of lipid deposition in PC3 and C4-2 cells. All data are expressed as the mean ± SEM of 3 independent experiments. *P < 0.05, **P < 0.01, ***P < 0.001 vs. their corresponding controls.

