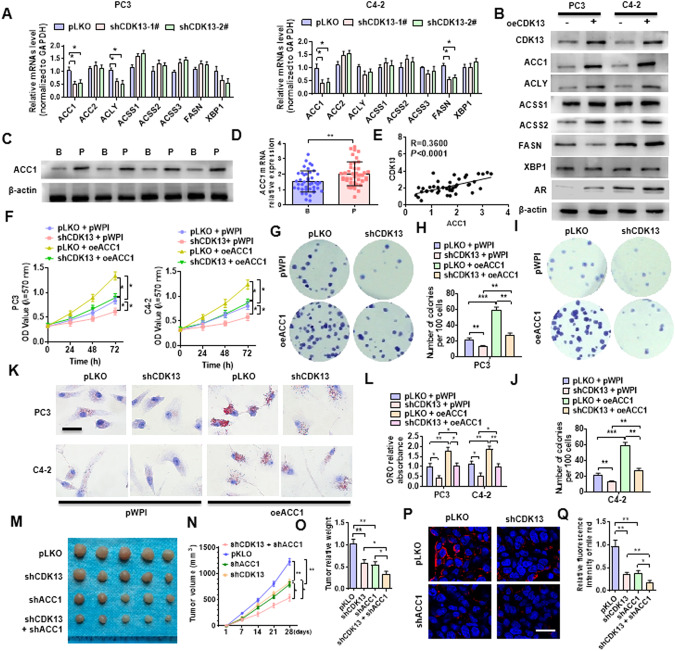
Fig. 3. ACC1 mediates CDK13-induced lipid deposition and PCa progression.
A PC3 and C4-2 cells were transfected with shCDK13-1# or shCDK13-2# or control vector, and then RT-qPCR was used to detect the expression of the indicated fatty acid synthase genes. B PC3 and C4-2 cells were transfected with oeCDK13 or control vector, and then Western blotting examined the indicated fatty acid synthases. C, D Western blot and RT-qPCR were used to detect the ACC1 expression in BPH (B) and PCa (P) tissues. E Correlation analysis between CDK13 and ACC1 expression in PCa tissues. F PC3 and C4-2 cells were transfected with shCDK13 or oeACC1 or both, and MTS assay was used to examine cell viability. G–J PC3 and C4-2 cells were transfected as in (F), and clone formation assay was used to detect cellular proliferation. K, L Cells were transfected as in (F), and ORO staining detected the lipid accumulation in cells. Scale bar = 20 μm. M PC3 cells were engineered to stably silence CDK13 or ACC1, alone or together, and xenograft tumor models were established by implanting these engineered cells into nude mice. Tumor sizes of each group were displayed after 21 days. N Tumor volumes were measured with calipers and calculated by the formula: (length × width2)/2. O, Wet weight of xenograft tumors was determined after tumor resection. P Nile red staining was used to detect the lipid deposition in xenograft tumors. Red: lipids; Blue: nuclei. Scale bar = 25 μm. Q Quantitative analysis of Nile red staining in (P). All data are expressed as the mean ± SEM of 3 independent experiments. *P < 0.05, **P < 0.01, ***P < 0.001 vs. their corresponding controls.

