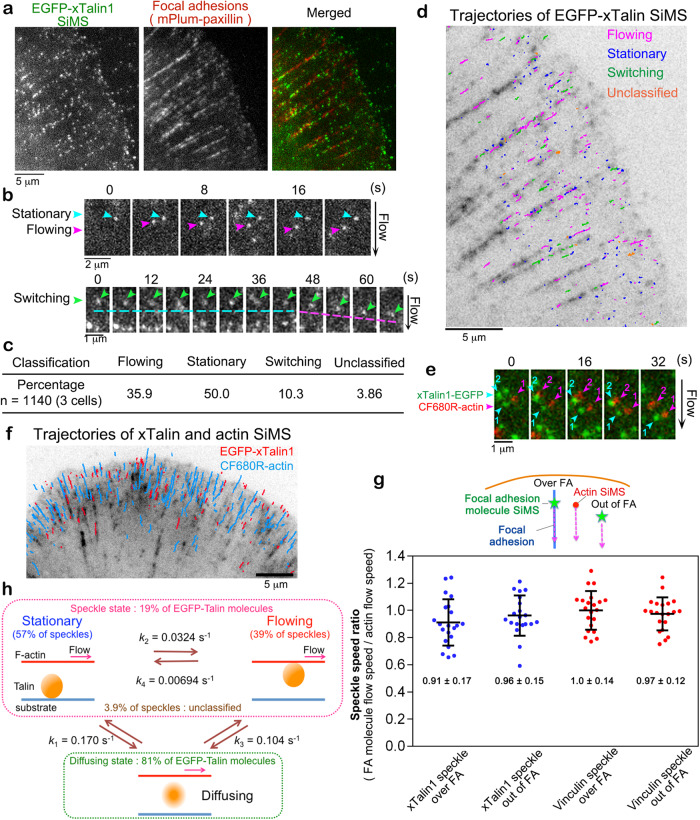
Fig. 1. Talin1 flows with a similar velocity to the retrograde actin flow in lamellipodia of XTC cells.
a Images of EGFP-xTalin1 SiMS (left) and mPlum-paxillin (middle) that marks FAs in lamellipodia. b The time-lapse images show representative motions of xTalin1 SiMS, which are stationary (upper, blue arrows), flowing (upper, pink arrows) and switching (lower, green arrows). The switching speckle in the lower row shows an example where the motion switches from stationary to flowing. c EGFP-xTalin1 SiMS found within a 120-s time window are classified into the indicated groups. d A trajectory map of xTalin1 SiMS observed within a 120-s time window is shown in an image of mPlum-paxillin (grey). Colors of lines indicate the indicated motions of speckles. e Merged time-lapse images of EGFP-xTalin1 SiMS (green) and CF680R-actin SiMS (red). The EGFP-xTalin1 SiMS with numbers (numbered blue arrowheads) and the CF680R-actin SiMS with numbers (numbered pink arrowheads) flow with a similar velocity. f Overlaid trajectories of EGFP-xTalin1 SiMS in a flowing motion (red lines) and CF680R-actin SiMS (blue lines) observed within a 120-s time window are shown in an image of mPlum-paxillin (grey). g The speckle speed ratio of the flow speeds of xTalin1 SiMS or vinculin SiMS to those of side-flowing CF680R-actin SiMS. The speeds of xTalin1 SiMS (n = 21) and vinculin SiMS (n = 21) flowing over FAs or those of xTalin1 SiMS (n = 20) and vinculin SiMS (n = 21) flowing outside adhesions were divided by the speeds of actin SiMS that flowed near and outside adhesions (side-flow) as shown in the upper schematic diagram. Data are pooled from two independent experiments for all conditions. Bars and values indicate mean ± SD. h Summary of single-molecule kinetics of xTalin1 in lamellipodia. k1 represents the rate constant for the dissociation of stationary EGFP-xTalin1 SiMS to diffusion. k2 represents the rate constant for the transition of EGFP-xTalin1 SiMS from stationary to flowing motions. k3 represents the rate constant for the dissociation of flowing EGFP-xTalin1 SiMS to diffusion. k4 represents the rate constant for the transition of EGFP-xTalin1 SiMS from flowing to stationary motions. Source data are provided as a Source Data file.

