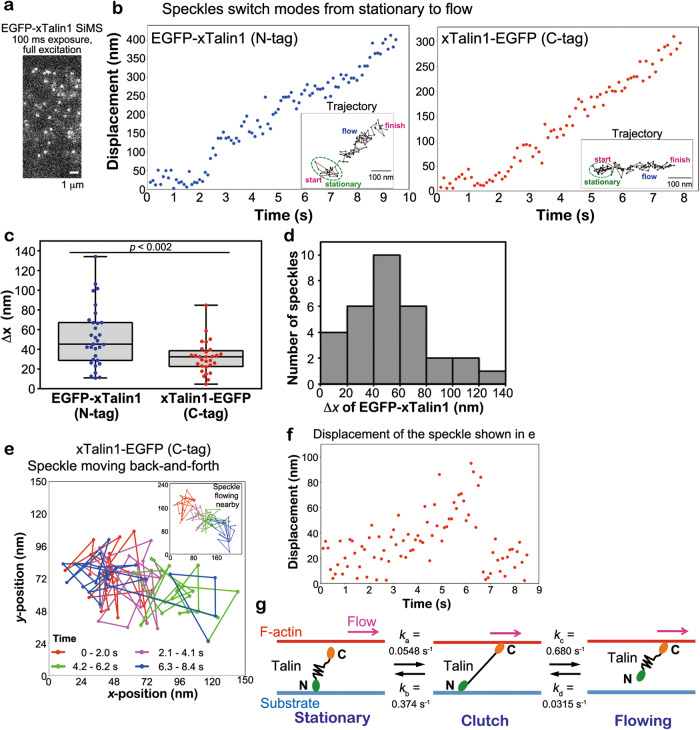
Fig. 2. Nanometer displacement measurements of EGFP-tagged xTalin1 SiMS.
a An image of EGFP-xTalin1 SiMS acquired with 100-ms exposure time and unattenuated 75-W xenon illumination. b Representative displacement plots of the central position of EGFP-xTalin1 (N-tag, left) and xTalin1-EGFP (C-tag, right) in the series of fast-tracking images. The central position was determined by the Gaussian-Fit model of Speckle TrackerJ software. The EGFP-xTalin1 SiMS and the xTalin1-EGFP SiMS switch the motion from stationary to flowing. Insets show trajectories of the same xTalin1 SiMS. c Box-and-whisker plots of the distance (Δx) in the flow direction between the position at the stationary state and the first position where the flow is detected. Box-and-whisker plot shows the median (the line in the box), the 25th and 75th percentiles (box), and the minimum and maximum values (whiskers). Data represents Δx of n = 31 EGFP-xTalin1 SiMS (blue dots) from seven independent experiments and those of n = 29 xTalin1-EGFP SiMS (red dots) from 6 independent experiments. The p value (0.00190) was determined using a two-tailed t-test. In our estimation, xTalin1 SiMS that jumps 40 nm or more can be measured with more than 75% probability (Fig. S3). d The Δx distribution of EGFP-xTalin1 SiMS shown in (c). e A representative trajectory of the central position of xTalin1-EGFP SiMS that exhibits back-and-forth motion. The dots indicate the central position of the speckle for each frame and are connected by lines (85 frames). The dots and lines are color-coded by the time after the start of tracking, as indicated. Inset shows the trajectory of a speckle flowing nearby, shown in the same color-coding. f Displacement plot of the central position of xTalin1-EGFP SiMS shown in (e). g Summary of switching kinetics of xTalin1 engaging and disengaging via an elastic transient clutch in Talin. ka represents the rate constant for the transition of stationary xTalin1 SiMS to a clutch state. kb represents the rate constant for the transition of xTalin1 SiMS from clutching to a stationary state. kc represents the rate constant for transition of clutching xTalin1 SiMS to a flowing state. kd represents the rate constant for the transition of flowing xTalin1 SiMS to a stationary state. Source data are provided as a Source Data file.

