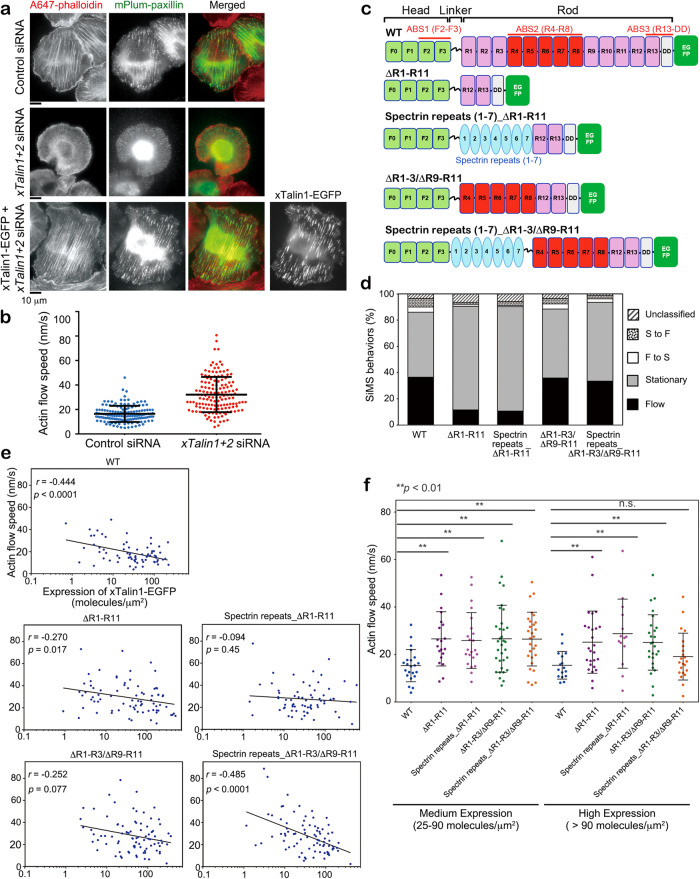
Fig. 3. Elastic α-helical bundle structures of the spectrin-repeats can substitute for xTalin1 stretchable domains.
a Images of F-actin and mPlum-paxillin in control (upper) and xtalin1 and xtalin2 double-knockdown (middle) Xenopus A6 cells (xTalin1/2 KD cells). F-actin was stained with Alexa 647 phalloidin (A647-phalloidin, left). Images in the lower column show F-actin and mPlum-paxillin in an xTalin1/2 KD cell expressing xTalin1-EGFP. b Depletion of xTalin1 and xTalin2 attenuates the retrograde actin flow speeds in lamellipodia. The actin flow speeds in control (n = 142, blue dots) and xTalin1/2 KD (n = 144, red dots) cells are shown. Each dot represents the average speed of 10 actin speckles in individual cells. Data are pooled from 17 independent experiments for both conditions. Bars indicate mean ± SD. c Schematic diagram of xTalin1 constructs expressed as C-terminally tagged EGFP-fusion proteins. d SiMS behaviors of xTalin1 and mutant constructs expressed in xTalin1/2 KD cells. SiMS of xTalin1 and the respective xTalin1 mutants are classified into the indicated groups. The data represents the results of analyzing xTalin1WT in a total of 330 SiMS, xTalin1ΔR1-R11 in a total 313 SiMS, xTalin1 spectrin repeats (1-7)_ΔR1-R11 in a total 234 SiMS, xTalin1ΔR1-R3/ΔR9-R11 in a total 225 SiMS, and xTalin1 spectrin repeats (1–7)_ ΔR1-R3/ΔR9-R11 in a total 410 SiMS. The actin-binding site 2 (ABS2) of xTalin1 is required for binding to F-actin in lamellipodia. e Relationship between the retrograde actin flow speeds and the expression level of EGFP-tagged xTalin1 and respective mutants. The data represents the results of analyzing xTalin1/2 KD cells expression xTalin1WT (n = 72 cells), xTalin1ΔR1-R11 (n = 78), xTalin1 spectrin repeats (1–7)_ΔR1-R11 (n = 68), xTalin1ΔR1-R3/ΔR9-R11 (n = 86), and xTalin1 spectrin repeats (1-7)_ ΔR1-R3/ΔR9-R11 (n = 83). Pearson’s correlation coefficients (r) and p-values (two-tailed) are indicated. Data are pooled from more than six independent experiments for all conditions f. The retrograde actin flow speeds in xTalin1/2 KD cells expressing xTalin1 (WT) and the indicated xTalin1 mutants at medium (med; 25–90 molecules /μm2) and high (> 90 molecules/μm2) levels. Bars indicate mean ± SD. **, p < 0.01, one-tailed Student’s t test. The exact p values are provided in Source Data. The results in e and f show that the xTalin1ΔR1-R3/ΔR9-R11 construct did not rescue a decrease in the retrograde actin flow speeds, but the xTalin1 mutant with spectrin repeats, xTalin1 spectrin repeats (1-7)_ΔR1-R3/ΔR9-R11, did rescue retrograde actin flow speeds at high expression levels. The data represents the results of analyzing xTalin1/2 KD cells expression xTalin1WT (n = 28 for med and n = 16 for high), xTalin1ΔR1-R11 (n = 24 for med and n = 26 for high), xTalin1 spectrin repeats (1-7)_ΔR1-R11 (n = 26 for med and n = 14 for high), xTalin1ΔR1-R3/ΔR9-R11 (n = 33 for med and n = 26 for high), and xTalin1 spectrin repeats (1-7)_ ΔR1-R3/ΔR9-R11 (n = 32 for med and n = 22 for high). Source data are provided as a Source Data file.

