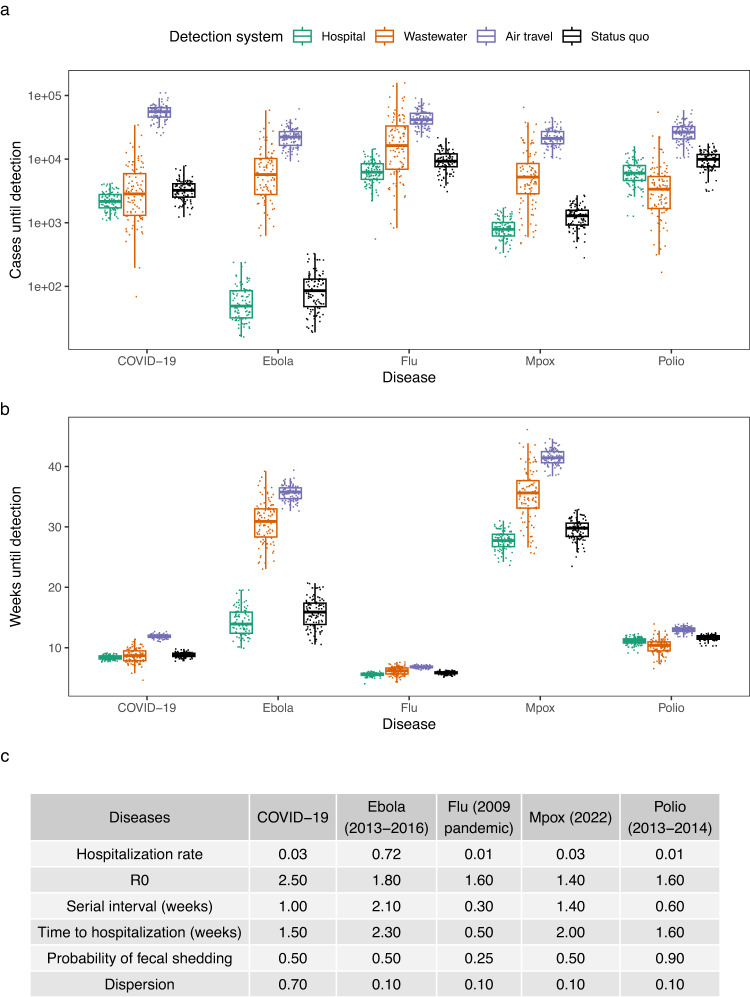
Fig. 2. Comparison of detection systems for different diseases.
a Earliness of detection for detection systems in cases across infectious diseases (hospital (teal), wastewater (orange), air travel (purple), and status quo (black)) in a 650,000-person catchment (box plots indicate median (middle line), 25th, 75th percentile (box), and points closest to 1.5× interquartile range (whiskers)). Each boxplot shows 100 simulations (points). b Earliness of detection for detection systems in weeks across infectious diseases in a 650,000-person catchment (box plots indicate median (middle line), 25th, 75th percentile (box), and points closest to 1.5× interquartile range (whiskers)). Each boxplot shows 100 simulations (points). c Epidemiological parameters of the studied diseases.

