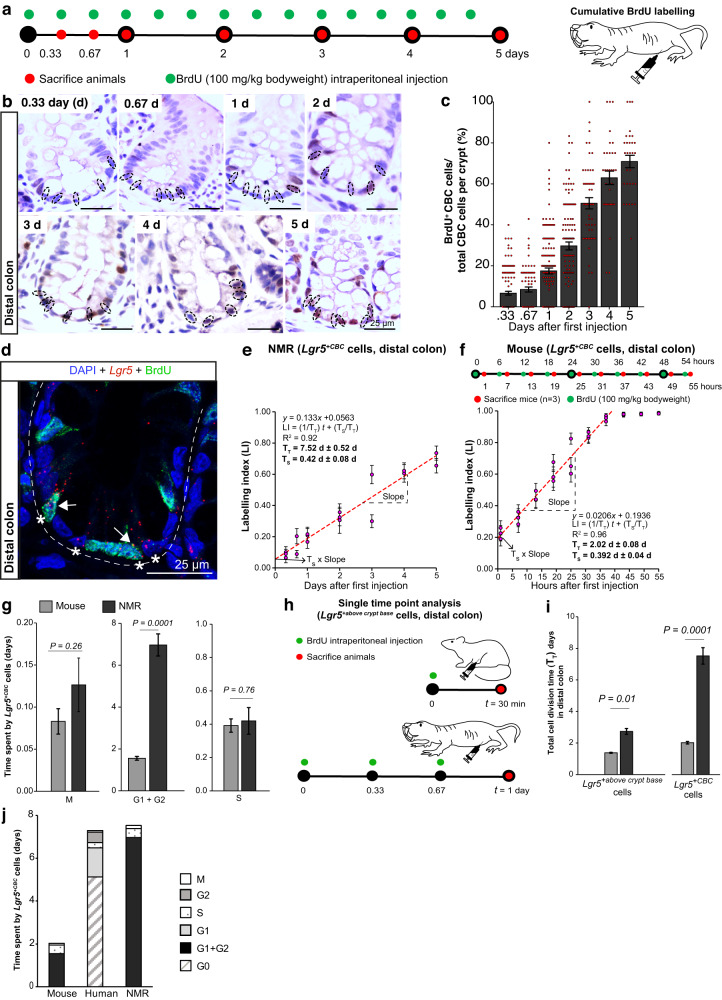
Fig. 4. Cytokinetics of colonic Lgr5+CBC across species.
a Schematic representation of BrdU injections (green) in NMRs and time of colonic tissue collection (red). b Images of NMR colonic crypt stained with anti-BrdU antibody (brown) and haematoxylin (blue). CBC cells are marked by dotted circles. c Bar graphs showing the mean percentage (±SEM) of labelled CBC cells (BrdU+CBC) over time, derived from counting n = 30 crypts per animal (3 NMRs sacrificed at 0.33, 1, 2 days; 2 at 0.67, 3, 4, 5 days). d Confocal image showing Lgr5 mRNA (red dots), BrdU (green) and DAPI (blue) in NMR colonic crypt cells after 3 days of BrdU injection. Asterisks (*) mark Lgr5+ cells at the crypt base (Lgr5+CBC). White arrows indicate Lgr5+CBCBrdU+ cells. e Scatter plot showing a linear increase in the BrdU labelling index (Number of Lgr5+CBCBrdU+/Total number of Lgr5+CBC) over time in NMRs. Each dot represents a mean of 40 crypts (±SEM) counted per animal (n = 3 animals at 0.33, 1 and 2 days; n = 2 animals at 0.67, 3, 4 and 5 days). f Top, Schema showing times when BrdU was injected (green) and colons harvested (red) in mice. Bottom, scatter plot showing a linear increase in the labelling index of murine Lgr5+CBC cells with time. Each dot denotes the mean (±SEM) of 30 crypts counted per animal (n = 3 animals/time point). g Bar graphs showing the duration of specific cell cycle phases of Lgr5+CBC cells in mice and NMRs. Exact P-values are indicated on the graphs. h Experimental design for measuring the total cell cycle time (TT) of Lgr5+ cells above the crypt base by injecting BrdU (green) in mice and NMRs and time of tissue collection (red). i Bar graphs showing TT of colonic Lgr5+ cells above the crypt base (left) and Lgr5+CBC cells (right) in mice and NMRs. Exact P-values are indicated on the graphs. j Stacked bar graphs showing the time (days) spent by mouse, human and NMR colonic ASCs in each phase of the cell cycle. Student’s t-tests using two-tailed, unpaired and unequal variance were used. Scale bars are indicated on the images (25 µm).

