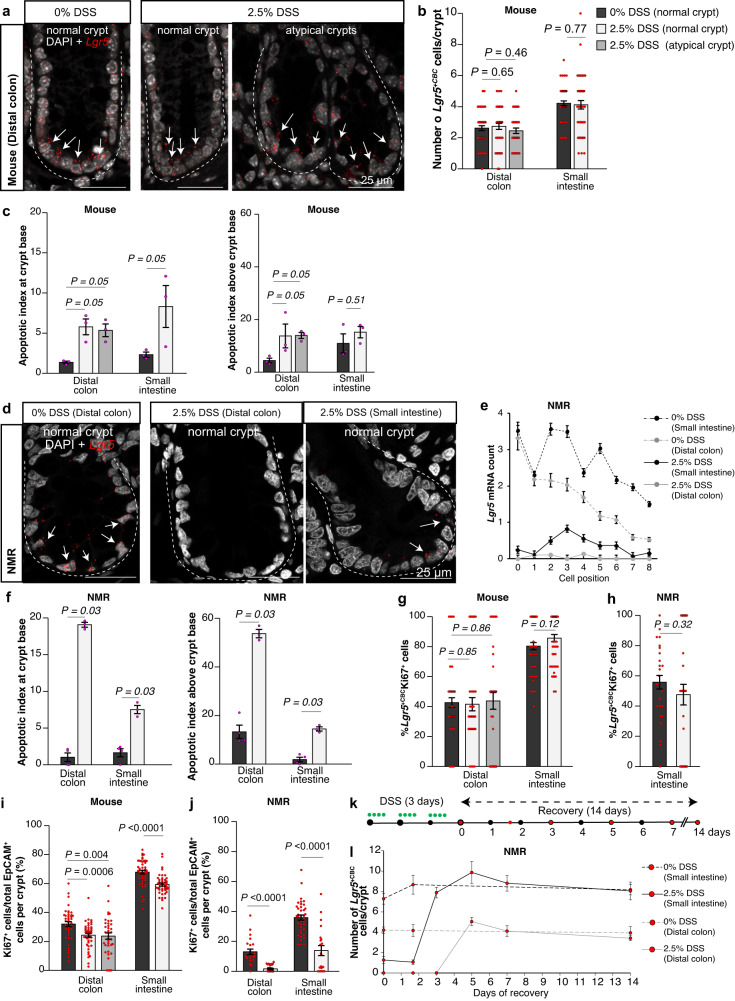
Fig. 7. Response of NMR intestinal crypt cells to DSS.
a Confocal images showing Lgr5 ISH (red) and DAPI (grey) staining in control (0%) and 2.5% DSS-treated murine colonic crypts. White arrows indicate Lgr5+CBC cells. b Bar graphs showing the mean (±SEM) of Lgr5+CBC cells per crypt between control and DSS-treated mice (n = 40 crypts counted from 3 animals/group). P-values from t-tests are indicated. c Bar graphs showing the mean (±SEM) TUNEL+ cells per 100 crypts (apoptotic index) at the crypt base (left) and above crypt base (right) in mice (n = 3 animals/group). P-values from the two-tailed Wilcoxon rank-sum test are given. d Confocal images showing Lgr5 ISH (red) and DAPI (grey) in NMR colonic and duodenal crypts. White arrows indicate Lgr5+CBC cells. e Scatter graph showing mean (±SEM) Lgr5 mRNA expression levels at specific cell positions along the crypt axis in control and DSS-treated NMRs (n = 50 crypts counted from 3 animals/group). f The mean (±SEM) TUNEL+ cells per 100 crypts at the crypt base (left) and above crypt base (right) in NMRs (n = 4 animals analysed in 0% and 3 animals in 2.5% DSS-treated group). P-values generated from the two-tailed Wilcoxon rank-sum test are indicated. g, h Bar graphs showing mean percentage (±SEM) of Ki67-positive cells in Lgr5+CBC cells per crypt in (g), mouse colon and duodenum (n = 40 crypts from 3 animals/group) and in (h), NMR duodenum (n = 30 crypts from 3 animals/group). P-values from t-tests are indicated. i, j Bar graph showing mean percentage (±SEM) of Ki67+ cells in all epithelial cells in the intestinal crypts of control and treated (i) mice (n = 40 crypts from 3 animals/group) and (j) NMRs (n = 30 crypts from 3 animals/group). P-values from t-tests are indicated. k Schema showing the recovery period in NMRs after 2.5% DSS treatment (green) and times of tissue collection (red). l Line graph showing the mean number (±SEM) of Lgr5+CBC cells in the duodenum (black) and colon (grey) of NMRs after DSS withdrawal (n = 20 crypts from 1 animal at each time-point). Where indicated, Student’s t-test using two-tailed, unpaired and unequal variance was employed. Scale bars are indicated on the images (25 µm).

