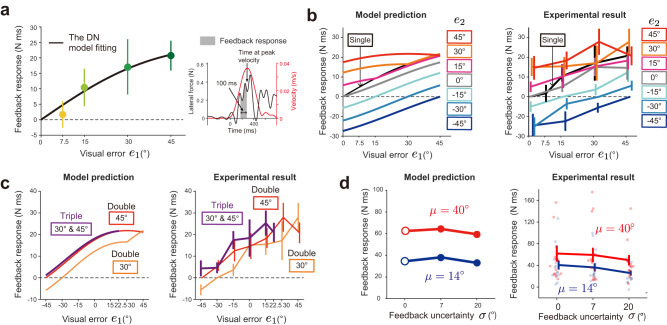
Fig. 7. The pattern of the feedback response in experiment 1 and 2.
a The experimental result of the feedback responses for the single-cursor perturbation condition in experiment 1 (n = 8). The feedback response was quantified by the force impulse from T-100 to T (T: the timing at the peak velocity) (right panel). The DN model can be fitted well with these feedback responses (left panel). b The DN model, fitted by the feedback responses for single perturbations, to predict the feedback responses for double perturbations (left panel). The experimentally observed feedback responses are consistent with the DN model prediction (right panel). c The DN model prediction (left panel) and experimental result of the feedback responses for triple perturbations (right panel). d The DN model, whose parameter was obtained by fitting the feedback responses for no uncertainty conditions in experiment. 2, to predict the change of the learning response to visual uncertainty (left panel), and the experimentally observed feedback responses in experiment 2 (right panel). The error bars represent the standard error across the participants.

