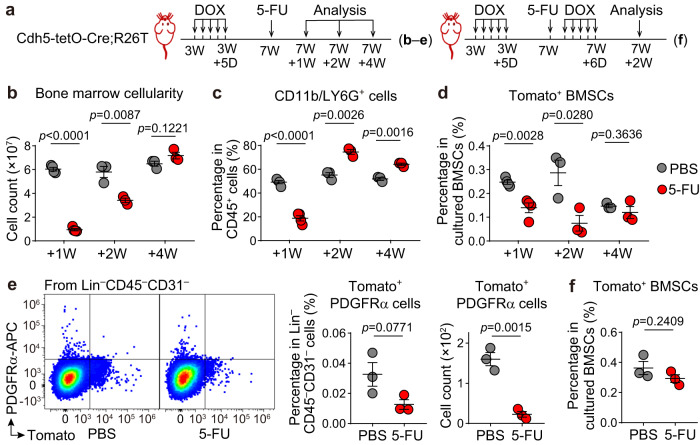
Fig. 7. Endothelial marker-expressing BMSC population does not increase in myeloablation-induced hematopoietic regeneration.
a Diagrams of protocols. Notes on the timeline indicate the age of mice. b–d Flow cytometry analysis depicting changes in bone marrow cellularity (b), the percentage of CD11b/LG6G+ myeloid cells in CD45+ hematopoietic cells (c), and the percentage of Tomato+ cells in cultured BMSCs (d) from Cdh5-tetO-Cre;R26T mice treated with PBS (n = 4, 3, 3 biologically independent animals at +1 W, +2 W, and +4 W, respectively) or 5-FU (n = 4, 3, 3 biologically independent animals at +1 W, +2 W, and +4 W, respectively). e Flow cytometry analysis showing the percentage and number of Tomato+PDGFRα+ cells within uncultured Lin−CD45−CD31− cells from Cdh5-tetO-Cre;R26T mice treated with PBS (n = 3 biologically independent animals, at +2 W) or 5-FU (n = 3 biologically independent animals, at +2 W). f Analysis of Tomato+ BMSCs from Cdh5-tetO-Cre;R26T mice that administered an extra round of doxycycline after PBS (n = 3 biologically independent animals) or 5-FU (n = 3 biologically independent animals) treatment. Data represent the mean ± S.E.M. Statistical significance was determined by two-tailed unpaired Student’s t-test. Source data are provided as a Source Data file.

